Download
1 / 23
230 likes | 300 Views
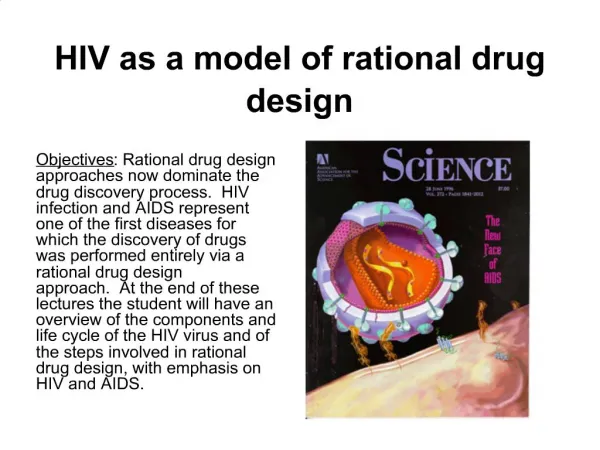
A Mathematical Model on CTL Mediated Control of HIV Infection in a Long Term Drug Therapy. Priti Kumar Roy. Centre for Mathematical Biology and Ecology Department of Mathematics, Jadavpur University Kolkata 700032, West Bengal, India. E-mail: pritiju@gmail.com

E N D
A Mathematical Model on CTL Mediated Control of HIV Infection in a Long Term Drug Therapy Priti Kumar Roy Centre for Mathematical Biology and Ecology Department of Mathematics, Jadavpur University Kolkata 700032, West Bengal, India. E-mail: pritiju@gmail.com Fax No. +913324146584, Ph.No. +919432095603 Collaborator : Sonia Chowdhury Amar Nath Chatterjee
Life cycle of HIV within a host cell Life cycle of HIV within a host cell
Introductory Observations • Over the last several years extensive research has been made in our understanding of the pathogenesis of HIV-1 infection. • HIV-1 pathogenesis and drugs which act either by blocking the integration of viral RNA into the host CD4+T cells, or by inhibiting the proper cleavage of viral proteins inside an infected cell. • HIV-1 infection is very much associated with an extremely vigorous virus specific Cytotoxic T- Lymphocyte (CTL) response that declines disease progression.
Introductory Observations • Retroviral therapy when began to a HIV-1 individual, the main clinical indicators of that HIV-1 positive patient are in the follow up both the viral load and the CD4+T cells count in blood plasma. • When therapy is started, make a portion to the immune cells to be toxic thereby introducing toxicity in the immune system of the individual. • Thus qualitative aspects of the HIV-1 specific CTL response is to be an important determinants of the efficacy of these response in controlling viral replication. • The main purpose of this study is to develop a mathematical framework that can be used to understand the various drug therapy in optimum controlled level.
Introductory Observations • In this paper we build on a mathematical model HIV-1 infection to CD4+T cell as a host cell including the mentioned inhibitor drug. • We have also considered that the growth of CD4+T cells is governed by a logistic equation. • During long term drug therapy some infected cell become toxic and this Cytotoxic T-lymphocyte (CTL) responses against virus producing cell. Since CTLs production is simulated by infected CD4+T cells. We have introduced a positive feed back function to generate excessive CTLs.
Formulation of HIV-1 Model Assumption-1 • To generate the model of T-cell infection by HIV, we first consider the T cell dynamics in the absence of HIV. We propose • Where being the rate of production of infectible CD4+T cells and d is the natural death rate per cell. • We assume that the proliferation of T cells is governed by a logistic function in which p is the maximum proliferation rate and Tm is the maximum T cell population density at which the proliferation shuts off.
Formulation of the Mathematical Model Assumption-2 • In the presence of HIV ,T cell become infected. The number of new infection at the steady state is proportional to x(t)y(t) and be the constant rate contact. • Based on the above assumption we can write down
Assumption- 3 • Now during long term drug therapy some infected cell become toxic and this Cytotoxic T-lymphocyte (CTL) responses against virus producing cell. Since CTLs production is simulated by infected CD4+T cells ,we have introduced a positive feed back function of the form in our model. • Then in the presence of CTL the model dynamics becomes • Where ρ is the killing rate of virus producing cell by CTL, and k is the equilibrium constant i.e rate of stimulation of CTL and b is the base line rate mortality of CTL .
Assumption- 4 • Let us introduce the non dimensional quantities and substituting these in the model equation
Theoretical study of the system Some basic results: • The model equation has the following positive equilibrium E 1 (P1,0,0) and E*(P*,Q*,R*) where, Basic reproductive ratio of the model, Clearly E 1 always exists and E* equilibrium P* is always greater than zero, and R* > 0 is also greater than zero.
Numerical Simulation: Table.1 Variables and parameters used in the models
Figure.1 Fig.1 shows that the model variables (x(t),y(t),and z(t)) oscillates initially. But system moves towards its stable region as time increases. It seems that as n increases from 1 to 6 the Uninfected CD4+T cell and CTL population density increases, where as the Infected cell population decreases.
Figure.2 Figure 2. Solution Trajectories of the system with different k. other parameter remained unchanged as in Table1. In Fig.2 The numerical simulation shows that the system approaches to its infection free steady state as k 0.005 and n 6. As k increases from 0.001 to 0.005 together with n from 2 to 6 the level of Infected CD4+T cells approaches to zero. It can be easily seen that The level of Uninfected CD4+T cells and CTL population increases with increases in k and n.
Figure.3 Figure 3. Solution Trajectories of the system with different ρ. other parameter remained unchanged as in Table1. In Fig.3 variation of three model variables are plotted against time. We see that as ρ increases from 0.1 to 0.3 the Uninfected CD4+T cell population increases gradually. Where as The Infected CD4+T cell population and level of CTL decreases rapidly. With the increase of n from 2 to 5 it has been observed that the level of Infected CD4+T cell approached towards zero whereas the CTL population density decreases gradually and Uninfected CD4+T cell population density very fast. This figure also shows that when n is n 5, ρ does not effect the solution trajectories for Uninfected and Infected cell population only.
In Delayed System Observation • CTL is secreted from the Infected CD4+T cells after introducing the mentioned inhibitor drug and this simulation does not produce instantaneously. Infected CD4+T cell has a positive feedback effect on CTL and there exist a time lag between this process. So we have incorporated a delay term τ in the third equation of our basic model. l
Delay Induced system In our above model we have incorporated delay
Figure.4 Figure 4. solution trajectories of the system for different values and n. Keeping all other parameter s are same as in Table.1. In Fig.4 we see that as increases the amplitude of oscillation of the system variables increases. It shows that when n=1 and = 1 the system for uninfected cell population moves towards its stable region. If increases the amplitude of oscillation increases but as time increases the system moves towards its asymptotically stable region. Fig.4 also shows limit cycle running in presence delay( > 0) together with n increases from 2 to 6. It also shows that delay does not effect on Uninfected CD4+T cell population when n=1. But when n increases together with delay factor the limit cycle is running. We also notice that when n=1 there is an oscillation in early stage, but as time increases the amplitude of oscillation decreases and moves towards stability. If n increases from 2 to 6 together with the level of CTL forms limit cycle.
Discussion and Conclusions: We have consider a basic mathematical model representing short term dynamics of HIV-1 infection in response to avail drug therapies. Our main aim is to find out the threshold values of the system parameter for which the disease can be controlled. Analytical study focuses on the qualitative aspects of the model dynamics. Here we show the existence and uniqueness of the solution of the dynamical variables P,Q and R locally holds in the positive octant, with the condition that all other parameters assume non negative values. Through the stability analysis we obtain the sufficient condition.
References [1] Carmichael, A., X. Jin, P. Sissons, and L. Borysiewicz, 1993. Quantitative analysis of the human immunodeficiency virus type 1 (HIV-1)specific cytotoxic T lymphocyte (CTL) response at different stages of HIV-1 infection: differential CTL response to HIV-1 and Epstein-Barr virus in late diseasse. J. Exp. Med. 177, 249-256. [2] Callaway, D. S., Perelson, A. S., 2002. HIV-1 infection and low virul loads. Bull. Math. Biol. 64, 29-64. [3] Coffin,J. M , 1995. HIV population dynamics in vivo: implications for genetic variation, pathogenesis, and therapy. Science. 267, 482-489. [4] Culshaw, R. V., Ruan, S., 2000. A delay -differentianal equation model of HIV infection of CD4+T-cells, Math. Biosci. , 165, 425-444. [5] Culshaw, R. V., Ruan, S., Webb. 2003. A mathematical model of cell-to-cell spread of HIV-1 that includes a time delay , Math. Biol., 46, 425-444. [6] Ho, D. D., Neumann, A. U., Perelson, A. S., Chen, W., Leonard, J. M. and Markowitz, M., 1995. Rapid turnover of plasma virons and CD4 lymphocytes in HIV-1 infection. Nature. 373, 123-126. [7] Kirschner, D. E., Webb, G. F., 1996. A model of treatment strategy in the chemotherapy of AIDS. Bull. Math. Biol. 58, 167-190. [8] L.Wang,M.Y.Li,2006.Mathematical analysis of the global dynamics of a model for HIV infection.MathBiosci 200,44-57. [9] Murray, J. M., Kaufmann, A. D., Kelleher, D. A., 1998. A model of primary HIV infection. Math. Biosc. 154, 57-85. [10] Nowak, M. A., May, R. M., 1993. AIDS pathogenis: Mathematical models of HIV and SIV infections. AIDS. 7, S3-S18. [11] Nowak, M. A., May, R. M., 2000. Virus dynamics, Cambridge University Press, Cambridge, UK. [12] Perelson, A. S.,Kirschner,D.E.,Rob.D.Boer, 1993.Dynamics of HIV Infection of CD4+T cells Math.Biosc.114,81-125. [13] Perelson, A. S., Neuman, A. U., Markowitz, J. M. Leonard and Ho, D. D. 1996. HIV 1 dynamics in vivo: viron clearance rate, infected cell life span, and viral generation time. Science. 271, 1582-1586. [14] Perelson, A. S.,Nelson,P.W., 1999. Mathematical Analysis of HIV-1 Dynamics in Vivo. SIAM Review. 41, 3-41. [15] Phillips, A. N., 1996. Reduction of HIV concentration during acute infection: independence from a specific immune response. Science., 271, 497-499. [16] Sebastian Bonhoeffer, John M. Coffin, Martin A. Nowak, 1997. Human Immunodeficiency Virus Drug Therapy and Virus Load. Journal of Virology. 71, 3275-3278. [17] Tian Bao-dan,Q.Yhang,2008. Equilibrium and Permanance for an Autonomous Completitive System with feedback Control.Appl.Mathematical Science 50(2),2501-2508
Acknowledgement Research is supported by the Department of Science and Technology, Government of India, Mathematical Science. Office No.SR/S4/MS: 558/08 and its a pleasure to acknowledge All India Council for Technical Eduction for their travel support to present the research work in WCE 2010, U.K.