Download
1 / 4
40 likes | 128 Views
0.8. A. *. 0.6. *. Fresh weight (g). 0.4. *. *. *. *. 0.2. 0.0. L1 L2 L3 L4 L5 L6 L7 L8 L9. L1 L2 L3 L4 L5 L6 L7 L8 L9. B. 0.4. Fresh weight (g). 0.2. L: *** G: *** LxG: *** L: ns G: *** LxG: ns. 0.0. Col. L er. Ws. C. Fresh weight (g).

E N D
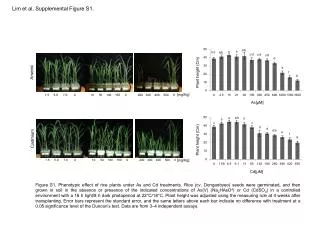
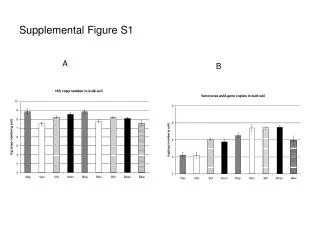
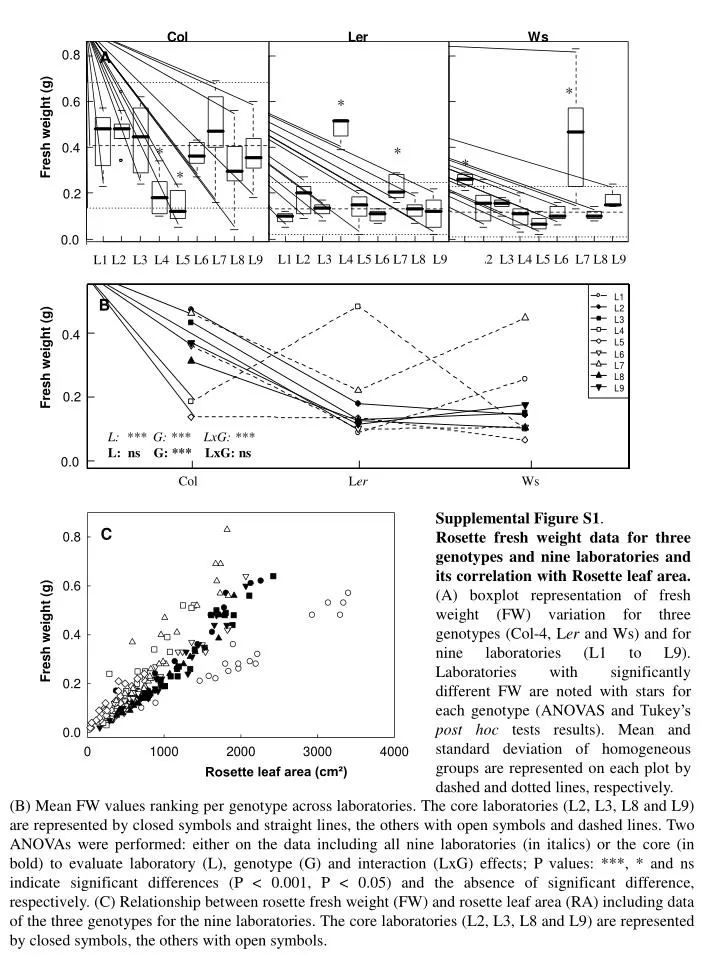
0.8 A * 0.6 * Fresh weight (g) 0.4 * * * * 0.2 0.0 L1 L2 L3 L4 L5 L6 L7 L8 L9 L1 L2 L3 L4 L5 L6 L7 L8 L9 B 0.4 Fresh weight (g) 0.2 L: *** G: *** LxG: *** L: ns G: *** LxG: ns 0.0 Col Ler Ws C Fresh weight (g) Rosette leaf area (cm²) L1 L2 L3 L4 L5 L6 L7 L8 L9 Supplemental Figure S1. Rosette fresh weight data for three genotypes and nine laboratories and its correlation with Rosette leaf area. (A) boxplot representation of fresh weight (FW) variation for three genotypes (Col-4, Ler and Ws) and for nine laboratories (L1 to L9). Laboratories with significantly different FW are noted with stars for each genotype (ANOVAS and Tukey’s post hoc tests results). Mean and standard deviation of homogeneous groups are represented on each plot by dashed and dotted lines, respectively. (B) Mean FWvalues ranking per genotype across laboratories. The core laboratories (L2, L3, L8 and L9) are represented by closed symbols and straight lines, the others with open symbols and dashed lines. Two ANOVAs were performed: either on the data including all nine laboratories (in italics) or the core (in bold) to evaluate laboratory (L), genotype (G) and interaction (LxG) effects; P values: ***, * and ns indicate significant differences (P < 0.001, P < 0.05) and the absence of significant difference, respectively. (C) Relationship between rosette fresh weight (FW) and rosette leaf area (RA) including data of the three genotypes for the nine laboratories. The core laboratories (L2, L3, L8 and L9) are represented by closed symbols, the others with open symbols.
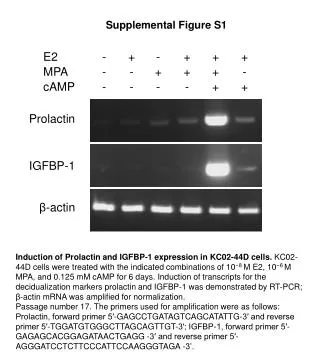
A D *** *** b b a a a a *** E *** B b b a a a a ns *** F C c b a Supplemental Figure S2. Aggregated core laboratory phenotypes per genotype. (A) Rosette leaf area. (B) Rosette leaf number. (C) Sixth leaf area. (D) epidermal cell density in leaf 6. (E) epidermal cell number in leaf 6. (F) mean epidermal cell area in leaf 6. Col, black; Ler, white; Ws, grey. Values were calculated by pooling data from the four core laboratories (L2, L3, L8, L9). Each variable was compared between genotypes with one-way ANOVA. P values: (***, **, *) indicate significant differences (P < 0.001, P < 0.01, P < 0.05); ns, no difference. Small case letters indicate significant differences according to the Tukey post hoc tests.
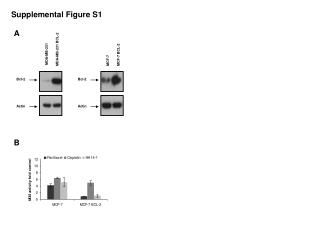
A B Supplemental Figure S3. Boxplots of gene-wise cv (coefficient of variation) values for gene expression values in replicate samples. (A) intra-laboratory cv values, (B) inter-laboratory cv values.
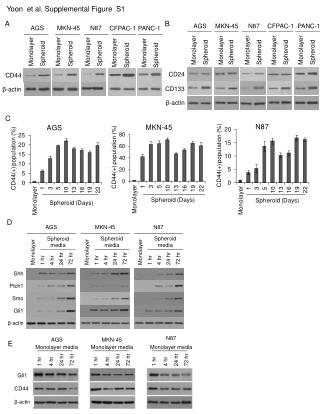
Supplemental Figure S4. Divisive hierarchical clustering of gene expression values for the top-500 most variable genes. (A) Based on Col samples only. (B) Based on Col, Ler and Ws samples. (C) Based on Col, Ler and Ws samples averaged per laboratory. Letters indicate the genotype: Col, C; Ler, L; Ws, W. Numbers identify laboratories (L).