Download
1 / 30
300 likes | 410 Views
Status of Hydrology Tasks Supporting Klamath Dam Removal Studies. Old Outline. Initially presented this info in terms of Data availability Data gaps Have been filling in many of the gaps Today’s goal is an update on methods and progress. Credit.

E N D
Status of Hydrology Tasks Supporting Klamath Dam Removal Studies
Old Outline Initially presented this info in terms of Data availability Data gaps Have been filling in many of the gaps Today’s goal is an update on methods and progress
Credit Work is being performed by staff of the Reclamation Technical Service Center Dave King – modeling and gains Brenda Kinkel – flood frequency analysis Dave Raff – climate change inputs, statistics Dave Sutley – SacSMA modeling, flood freq.
Outline Needs for Hydrology Information De-Construction Effects Analysis Defining Flows at Keno Current Conditions Future Conditions Hydrology Downstream of Keno Current Conditions Future Conditions
Outline Needs for Hydrology Information De-Construction Effects Analysis Defining Flows at Keno Current Conditions Future Conditions Hydrology Downstream of Keno Current Conditions Future Conditions
Needs for Hydrology InformationWho needs it? What for? Construction Flood risk analysis Sizing coffer dams Effects Analysis - Compare Effects of “No Action” to Dam Removal Alternatives Sediment Mobilization / River Hydraulics Water Quality Biology/Fisheries Economics Power Production Recreation
Needs for Hydrology InformationHow much? Construction One-year traces – to cover de-construction effort Hydrology reflects current conditions Effects Analysis Determine effects up to 50 years into the future Hydrology should reflect current and potential future conditions
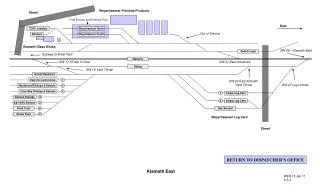
Needs for Hydrology InformationWhere? Construction Flows at Dam Sites - JC Boyle, Copco, Iron Gate Effects Analysis Dam Sites - JC Boyle, Copco, Iron Gate Lower Basin Locations Streamflow Gage Sites Others Note – need for flow information is below Keno
Outline Needs for Hydrology Information De-Construction Effects Analysis Defining Flows at Keno Current Conditions Future Conditions Hydrology Downstream of Keno Current Conditions Future Conditions
Defining Flows at Keno What Defines Keno Flow Hydrology Upstream of Keno Klamath Project Operations Criteria Current Conditions Current Climate Project Operations Scenario Future Conditions Consider Climate Change Project Operations Scenario
Defining Flows at Keno • Upper Basin Hydrology • Operations Criteria • UKL Elevation • Iron Gate Flow • Project Demands • Water Use Strategy • Model Computes Resulting Flows at Keno
Defining Flows at KenoUpper Basin Hydrology – Current I Have an historical record 1961-2009 Earlier years clearly wetter than later years Use of full period of record for de-construction justified because it’s conservative for that purpose Effects analysis using 1977-2009 (33 years) Let’s review the period-of-record issue
Defining Flows at KenoUpper Basin Hydrology – Current II Effects analysis using 1977-2009 (33 years) Need 50-year traces – econ analysis outlook horizon Flow Generation Approaches (Getting 50 Years from 33) Index Sequential Method Parametric Stochastic Trace Generation Non-parametric Random Selection from Historic Period Need 50 traces – adequate to capture inter-annual and month-to-month uncertainty
Flow Generation Approaches Index Sequential Method “Loop” or “wrap around” successive repetitions of the observed record Parametric Stochastic Trace Generation Assumes data can be fitted to a statistical distribution Distribution used to generate realistic possible traces Non-Parametric Random Selection Assumes observed data represents all possibilities Methodology incorporates month-to-month and year-to-year variability (i.e. dry-wet, dry-dry, wet-wet, wet-dry)
Defining Flows at KenoProject Operations Scenarios WY 2009 Ops (2002 NMFS BO, 2008 FWS BO) 1/12/10 KBRA Scenario – not final and does not include a drought plan Each scenario considered w/wo storage adjacent to UKL in Agency Lake Ranch/Barnes Ranch areas Four Scenarios – capture range of current and projected future operations
Defining Flows at KenoUpper Basin Hydrology – Current III Model runs to be made 4 operations scenarios 50 current condition inflow traces
Defining Flows at KenoUpper Basin Hydrology – FutureOverview Select a set of climate projections that bracket potential futures Download temperature and precipitation data Run surface water hydrologic model to develop inflows Modify other planning model inputs appropriately Run planning model to compute flows at Keno Here’s a brief review
Computing Flow at Keno Upper Basin Hydrology for Projected Climate Operations Criteria UKL Elevation Iron Gate Flow Project Demands Water Use Strategy Model Computes Resulting Flows at Keno
Climate Projection Fundamentals Illustrated 1. Define Emissions Scenario (GHG) 5. Assess Operations Response 2. Simulate Climate (GCM) 3. Bias-Correct and Spatially Downscale to Regional Output 4. Assess Water Supply Response
Defining Flows at KenoUpper Basin Hydrology – Future I Using 5 climate projections selected from 75 archived projections represent a range of future conditions Downscaled T and P data downloaded 150-year traces of monthly data covering 1950-2099 Monthly data disaggregated to daily using 10 weather sequences – statistically defined to capture random nature of monthly-daily patterns Ultimate product – 50 traces of 150 year daily P & T These traces drive the surface hydrology / rainfall runoff model
Defining Flows at KenoUpper Basin Hydrology – Future II SacSMA model calibrated with historical P & T data for years 1961 – 1999 (39 years) Model run with the 50 traces of climate forcings Output – 50 traces of 150 years of 6-hourly data for inflows to UKL Develop relationships SacSMA results with historical data compared to… SacSMA results with CC data for a specific 39-yr period 50 sets of monthly and annual relationships developed
Defining Flows at KenoUpper Basin Hydrology – Future III Relationships applied to inputs to the planning/operations model Define hydrologic inputs for 50 potential future climate traces Model runs to be made 4 operations scenarios 50 climate change inflow traces
Defining Flows at KenoTransition to Lower River For both Current and Future levels of development Developing 50 inflow traces for model inflows Model will be run 400 times 4 ops scenarios 50 inflow traces 2 levels of development Result is 400 traces of flows at Keno Link with associated traces of gains to generate flows in the lower river
Outline Needs for Hydrology Information De-Construction Effects Analysis Defining Flows at Keno Current Conditions Future Conditions Hydrology Downstream of Keno Current Conditions Future Conditions
Defining Lower Basin FlowsCurrent Conditions Have historical flows/gains for 1961-2009 Period of record issues same as for Upper Basin Use 1977-2009 (33-year) period Use same parametric stochastic process to generate gains at locations below Keno Selections from the flow distributions are made such that upstream-to-downstream correlations are preserved Result is 50 traces of gains – Keno to the mouth To be added to model-defined Keno flows
Defining Lower Basin FlowsFuture Conditions Same 5 climate projections and weather sequences 50 traces of daily P & T inputs for lower basin areas SacSMA models obtained for lower basin flow points Same process followed as for upper basin application 50 SacSMA runs produce flows Define relationships between flows produced by historical P/T and Climate Change P/T Apply relationships to historical lower basin gains to define 50 new traces of gain reflecting range of potential futures Add future local gains to future Keno flows
Summary Flood frequency analysis to support construction nearing completion – expected by 2/15/2010 Operations scenarios – Current & KBRA Historical period 1977-2009 used as the basis for development of stochastic hydrologic inputs 200 Runs made for Current Climate Five Climate Scenarios selected – combined with 10 weather sequences for monthly-daily P/T disag SacSMA-Snow17 models for upper/lower basins Planning model run with new upper basin inflows, resulting in 200 traces for flows at Keno under future climate
Questions • Discussion • Suggestions