Download
1 / 56
570 likes | 698 Views
Intermediate x86 Part 4. Xeno Kovah – 2010 xkovah at gmail. All materials are licensed under a Creative Commons “Share Alike” license. http://creativecommons.org/licenses/by-sa/3.0/. Interrupts & Debugging.

E N D
Intermediate x86Part 4 Xeno Kovah – 2010 xkovah at gmail
All materials are licensed under a Creative Commons “Share Alike” license. • http://creativecommons.org/licenses/by-sa/3.0/
Interrupts & Debugging • We know that IDT[3] is the Breakpoint Exception, and that it’s important enough for INT 3 to have a separate one byte opcode form (0xCC). • INT 3 is what debuggers are using when they say they are setting a “software breakpoint” (the default breakpoint in most cases) • When a debugger uses a software breakpoint, what it does is overwrite the first byte of the instruction at the specified address. It keeps its own list of which bytes it overwrote and where. Then when breakpoint exception is received, it looks up the location, replaces the original byte and lets the instruction execute normally. Then typically it overwrites the first byte again (subject to configuration) so that the breakpoint will be hit if the address is executed again.
Lab: ProofPudding.c • A program which reads its own memory in order to confirm that when a breakpoint is set, it overwrites a byte with the 0xCC form of the breakpoint interrupt, INT 3
Hardware Support for Debugging Vol. 3b, Sect. 18 • Most debuggers also have support for something called a “hardware breakpoint”, and these breakpoints are more flexible than software breakpoints in that they can be set to trigger when memory is read or written, not just when it’s executed. However only 4 hardware breakpoints can be set. • There are 8 debug registers DR0-DR7 • DR0-3 = breakpoint linear address registers • DR4-5 = reserved (unused) • DR6 = Debug Status Register • DR7 = Debug Control Register • Accessing the registers requires CPL == 0 • MOV DR, r32 • MOV r32, DR
DR7 - Debug Control Register • L0-3 (local breakpoint enable) flags - Enables the DR0-3 breakpoint. But these flags are cleared on task switches to ensure that they do not fire when dealing with a different task. • G0-3 (global breakpoint enable) flags - Enables the DR0-3 breakpoint. Does not get cleared on task switch, which is what makes it global obviously. • LE & GE (local and global exact breakpoint enable) flags - If set to 1, enables detection of the exact instruction that caused a data breakpoint. Not supported on P6 microarchitecture and later, but if you need maximum compatibility for exact breakpoint detection you’re recommended to set both to 1.
DR7 - Debug Control Register (2) • GD (General Detect) flag - If set to 1, causes a debug exception prior to MOV instructions which access the debug registers. The flag is cleared when the actual exception occurs though, so that the handler can access the debug register as needed. • The R/W0-3 are interpreted as follows: • 00 = Break on instruction execution only. • 01 = Break on data writes only. • If(CR4.DE == 1) then 10 = Break on I/O reads or writes. • If(CR4.DE == 0) then 10 = Undefined. • 11 = Break on data reads or writes but not instruction fetches.
DR7 - Debug Control Register (3) • LEN0-4 bits specify what size the address stored in the DR0-3 registers should be treated as. • 00 = 1-byte • 01 = 2-bytes • 10 = Undefined (or 8 bytes, see note below) • 11 = 4-bytes. • While you might set a 1 byte size for an address pointing at the first byte of an instruction, on a break-on-execute, you might want to set a 4 byte breakpoint on writes to a memory location you know to be a DWORD. • “For Pentium4 and IntelXeonprocessors with a CPUID signature corresponding to family 15 (model 3, 4, and 6), break point conditions permit specifying 8-byte length on data read/write with an of encoding 10B in the LENx field.”
DR6 - Debug Status Register • B0-B3 (breakpoint condition detected) flags - When the B{0,1,2,3} bit is set, it means that the {0th,1st,2nd,3rd} condition specified in DR7 has been satisfied. The bits are set even if the DR7 says that condition is currently disabled. I.e. software needs to crosscheck these bits against whether it currently cares. • BD (debug register access detected) flag - Indicates that the next instruction will try to access the debug registers. This flag only enabled if GD (general detect) flag in DR7 is set. Thus this signals if someone else was trying to access the debug registers. NO! MINE!
DR6 - Debug Status Register (2) • BS (single step) flag - If set, the debug exception was triggered by single-step execution mode (talked about later). • BT (task switch) flag - Related to TSS so we don’t care • “Certain debug exceptions may clear bits 0-3. The remaining contents of the DR6 register are never cleared by the processor. To avoid confusion in identifying debug exceptions, debug handlers should clear the register before returning to the interrupted task.” Seems like an important point if you’re making a debugger :)
So what actually happens when a hardware breakpoint fires? • It fires IDT[1], a Debug Exception • When it is an execute breakpoint or general detect (someone trying to access debug regs) it’s a fault. • For other cases It’s A Trap! • That means if it was a break on write, the data is overwritten before the exception is generated. A handler which wants to show the before and after is responsible for keeping a copy of the before value. • Instruction breakpoints are actually detected before the instruction executes. Therefore if the handler doesn’t remove the breakpoint, and it just returned, the same exception would be raised over and over. • This is where the Resume Flag (RF) comes into play
Resume Flag (RF in EFLAGS) • When the RF is set, the processor ignores instruction breakpoints. • To set the flag, a debug interrupt handler would manipulate the EFLAGS stored on the stack and then use IRETD (POPF, POPFD, and IRET do not transfer RF from the stack into EFLAGS) • “The processor then ignores instruction breakpoints for the duration of the next instruction.” “The processor then automatically clears this flag after the instruction returned to has been successfully executed.”
Trap Flag (TF in EFLAGS) • Only being able to invoke the debug exception handler on 4 addresses is somewhat limiting. • When TF is 1, it causes a debug exception after every instruction. This is called “single-step” mode. • Useful for capabilities such as “step out” which just steps until it steps through a RET • Remember that we said that if the debug exception is in response to single stepping, it sets the BS flag in DR6. • The processor clears the TF flag before calling the exception handler, so if it wants to keep single-stepping it needs to set it again before returning. • Also, the INT and INTO instructions clear TF. So a single stepping debugger handler should compensate accordingly.
WinDbg Hardware Breakpoints • Hardware Breakpoint = ba rather than bp. Stands for break on access, where access can be read/write/execute or port IO. Below is a simplified form of the command (see help page for full form) • baAccessSizeAddress • Access • r = read/write • w = write • e = execute • i = I/O port (talked about later) • Size. Width of data over which you want the breakpoint to have effect. Must be 1 for access = e, but can be 1, 2, 4, or 8 for other types • Address. Where you want the breakpoint to be targeted.
HW Breakpoint Examples • ba e 1 0x80541ac0 • Break on execute of address 0x80541ac0 (windbg specifies size must be 1 on break on execute) • ba w 4 0x80541ac0 • Break if anyone reads from the 4 bytes specified by 0x80541ac0 to 0x80541ac4 • ba r 2 0x80541ac0 • Break if anyone reads or writes from byte 0x80541ac0 or 0x80541ac1(remember, the debug registers don’t have a way to specify only read)
Lab: Watching the debugger debug • TryToRunTryToHide.c take 2 • A discourse on the efficacy of using a hardware breakpoint on the INT 3 handler, rather than a software breakpoint ;)
Malware Use of Debug Regs • “A packer such as tElock makes use of the debug registers to prevent reverse-engineers from using them. “ • http://www.securityfocus.com/infocus/1893 • The Art of Unpacking (lists various anti-debug tricks including reading the debug registers) • https://www.blackhat.com/presentations/bh-usa-07/Yason/Whitepaper/bh-usa-07-yason-WP.pdf • But I thought you had to be running in ring 0 to manipulate debug registers? Well, yes, but windows saves thread information (including the contents of the debug register) into a CONTEXT structure, and provides userspace a way to get and set thread context, thus letting malware detect .
The New Stuff (Which I don’t yet know enough about to teach. Read 3b, Sect. 18.4 on your own) • “P6 family processors introduced the ability to set breakpoints on taken branches, interrupts, and exceptions, and to single-step from one branch to the next. This capability has been modified and extended in the Pentium 4, Intel Xeon, Pentium M, IntelCoreTM Solo, IntelCoreTM Duo, IntelCoreTM2 Duo, IntelCoreTM i7 and IntelAtomTM processors to allow logging of branch trace messages in a branch trace store (BTS) buffer in memory.” • The branch trace is basically a stack which holds pairs of addresses which represent the source of the branch and the destination. • Pedram Amini talked about the performance improvement vs. single step mode here: • http://www.openrce.org/blog/view/535/Branch_Tracing_with_Intel_MSR_Registers
Port I/O • “In addition to transferring data to and from external memory, IA-32 processors can also transfer data to and from input/output ports (I/O ports).” • “I/O ports are created in system hardware by circuity that decodes the control, data, and address pins on the processor. These I/O ports are then configured to communicate with peripheral devices.” • “An I/O port can be an input port, an output port, or a bidirectional port.” Vol 1, Sect 13
Ports • There are 2^16 8bit IO ports, numbered 0-0xFFFF. • Can combine 2 or 4 consecutive ports to achieve a 16 or 32 bit port. • “32-bit ports should be aligned to addresses that are multiples of four (0, 4, 8, ...).”
Accessing the Ports • You cannot use the IN/OUT instructions to access the ports unless you have sufficient privileges. • There is a 2 bit IOPL (I/O Privilege Level) field in EFLAGS. You can only perform IO if CPL <= IOPL. • Also FYI, the STI/CLI instructions we saw before also are only allowed if CPL <= IOPL. • Most OSes set IOPL to 0 • But think back to privilege rings. An appropriately modified OS (say, a paravirtualized one), could allow IOPL to be something like 2.
IN - Input from Port • Note it’s DX, not DL. That means the DX form can specify all 2^16 ports, but the IMM8 form can only specify 2^8 ports. • “When accessing a 16- and 32-bit I/O port, the operand-size attribute determines the port size.” (Because as usual there’s an overloaded opcode for 16/32 bit form) • Remember if you’re in a 16 bit segment it’s 16 bit, if you’re in a 32 bit segment it’s 32 bit. But you can override it with an operand size instruction prefix which is talked about later.
OUT - Output to Port • Basically the same caveat as IN
Lab: ParlorTrick.c • Accessing the vmware “backdoor” IO port. • For more tricks, see VMBack - http://chitchat.at.infoseek.co.jp/vmware/backdoor.html
The 8042 keyboard controller • Lots of good info here: http://www.computer-engineering.org/ps2keyboard/ • The original IBM PC used a chip by the name of 8042 as the keyboard controller. PS/2 keyboards use this chip, and luckily for us, so do VMWare virtual machines by default (since PS/2 is way simpler than USB) • The 8042 has a status/command register mapped to IO port 0x60 and a data register mapped to IO port 0x64
Lab: basic_hardware.cSpooky action at a distance • Code taken as-is from http://www.rootkit.com/vault/hoglund/basic_hardware.zip • Starts a timer in the kernel which calls a function every 300ms. That function talks to the keyboard controller using port IO, and sets a new value for the LED indicator lights for Num/Caps/Scroll lock
Lab: bhwin_keysniff.cLow level keystroke logging • Code taken from http://www.rootkit.com/vault/hoglund/basic_keystroke.zip with changes and hackery to get it to work as noted inline • Every time a key is pressed/released, it triggers an interrupt. In our case it is INT[0x93] which is usually handled by i8042prt.sys’s I8042KeyboardInterruptService() function. • Keys are represented as “scancodes” indicating position on the keyboard, not ASCII values. • This code hooks the keyboard interrupt( i.e. puts itself into the IDT descriptor) and then reads and stores the incoming scancode, puts it back into the buffer, and then calls the original handler.
HW Breakpoint Examples • WinDbg commands to set a breakpoint on port IO • ba i 1 0x60 • Break on 1 byte access to port address 0x60 • The value read in will be in al • ba i 4 0x60 • Break on 1-4 byte access to port address 0x60 • The value read in will be in al, ax, or eax depending on the size used in the IN instruction
Debug Reg Keyboard Sniffer • We just saw from the bhwin_keysniff.c source, that you speak to port 0x60 to talk to the 8042 keyboard controller. • We saw earlier that the debug registers have an option to break on port IO access. • Combine, and you get a keyboard sniffer which hooks the debug breakpoint handler rather than keyboard handler (but still has to hook the IDT to catch the debug register interrupts, INT 1). • It is admittedly fragile. If someone overwrites the debug reg entry, purposely or accidentally, it is blinded. But it could keep polling to check if it has been removed, and replace itself. Though sooner or later an analyst is going to wonder why his hardware breakpoints keep getting missed and overwritten. • PoC: http://www.rootkit.com/vault/chpie/0x60_hook.zip
Tap Into Your Hidden Potential andDisassemble Binary Using OnlyTHE POWER OF YOUR MIND!!! • Foretell the future (values of registers)! • Impress friends and cow orkers! • Be the life of the party! • Burn excess calories! • Live in infamy! • Call Now! Just 9 easy payments of 9.99!
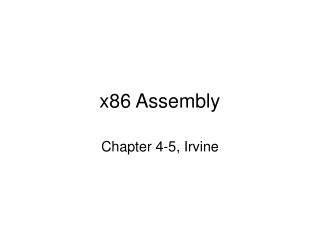
Explaination of “r/m32s” • What I called an “r/m32” is actually the combination of the “ModR/M” and “SIB” bytes from the previous slide • I had previously promised to get into why AND has a /4 in its opcode column. • Vol. 2a page 3-2 section 3.1.1.1’s explanation of the opcode column says: • “/digit - A digit between 0 and 7 indicates that the ModR/M byte of the instruction uses only the r/m (register or memory) operand. The reg field contains the digit that provides an extension to the instruction's opcode.” • “/r — Indicates that the ModR/M byte of the instruction contains a register” • operand and an r/m operand. • And here’s what 3.1.1.2 says about the instruction column: • OK, what’s a “ModR/M” byte?
The src/dst register part The memory part
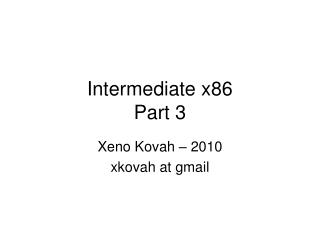
The base register This is misleading. Looking at the chart you would think you can’t access [ESP], but you can (if your instruction either uses /r (or /5? Any such instruction?)
Examples of testing • (You have to put each _emit on its own line, I just wrote them this way for conciseness) • __asm{_emit 0x80; _emit 0x20; _emit 0xFF;}; • 80 20 FF and byte ptr [eax],0FFh • __asm{_emit 0x80; _emit 0x60; _emit 0x20; _emit 0xFF;}; • 80 60 20 FF and byte ptr [eax+20h],0FFh • __asm{_emit 0x80; _emit 0x00; _emit 0xFF;}; • 80 00 FF add byte ptr [eax],0FFh • Wait, add? But I’m still using 0x80 at the front?!
Overloaded Opcodes • We’ve already seen cases where opcodes are overloaded for different data size, but some like 0x80 are also overloaded for things like arithmetic/logical operations • Back to the tables!
More than one way to skin an instruction • If you read “skin” to mean “remove the skin of” rather than “put a skin onto”, then you are sick and should seek help :P • ModRM = 0x0 = [EAX] • ModRM = 0x8 = [EAX] - To the tables! • Note that you only have the option of using either if your opcode is specified with a /r (like MOV) rather than a /digit (like AND/ADD) • ModRM = 0x4 = Add SIB, SIB = 0x0 = [EAX] therefore 0x4 0x0 = [EAX] • Yet another reason trying to use binary signatures sucks in x86
Instruction Prefixes • There are 4 groups of prefixes specified • Group 1: LOCK/REP/REPNE • Group 2: Segment Override, Branch Hints (Seemingly unrelated, but put together because the prefix bytes are overloaded) • Group 3: Operand-size override • Group 4: Address-size override Vol 2a, Sect 2.1.1
Lock prefix • Lock prefix = 0xF0 • Locks the memory bus, preventing anyone else from changing memory until the instruction is done • lock xchg eax, [ebx] • Used for creating the simplest mutual exclusion primitive – mutex • Cannot be applied to all instructions (see the specific instruction’s details)
REP prefixes • REP/REPE/REPZ = 0xF3 • REPNE/REPNZ = 0xF2 • Both apply only to string (movs, stos, etc-ending-in-s) and in/out instructions • REP • 0xA5 = movsd es:[edi], ds:[esi] • 0xF3 0xA5 = rep movsd es:[edi], ds:[esi]
Segment Override Prefixes • “0x2E—CS segment override (use with any branch instruction is reserved) • 0x36—SS segment override prefix (use with any branch instruction is reserved) • 0x3E—DS segment override prefix (use with any branch instruction is reserved) • 0x26—ES segment override prefix (use with any branch instruction is reserved) • 0x64—FS segment override prefix (use with any branch instruction is reserved) • 0x65—GS segment override prefix (use with any branch instruction is reserved)” • Note, they’re only reserved with conditional branches • FF 24 24 jmp dword ptr [esp] • 65 FF 24 24 jmp dword ptr gs:[esp] • 8B 04 24 mov eax,dword ptr [esp] • 26 8B 04 24 mov eax,dword ptr es:[esp]
Branch Hints • Tell the processor’s branch prediction unit to assume that a branch will be taken one way or the other. • Implicitly you would only do this when you knew that your code was structured such that it ran contrary to the default rules for branch prediction. • Since good compilers try to generate code with the branch prediction defaults in mind, one would only expect to see this with handcoded asm. • 0x2E – Branch not taken • 0x3E – Branch taken • These can only be used with conditional jumps (Jcc) • Note that they are also valid segment override prefixes (and since there are more segment override prefixes than 0x2E/0x3E, I’m not sure why it says the other things should not be used with branch instructions)
Operand and Address Size Override Prefixes • 0x66 – Operand Size Override • 0x67 – Address Size Override • In both cases, if something was in a 32 bit segment, it would be using 32 bit size, but adding these before instructions forces operands or addresses to be treated as 16 bits. (And if things were in 16 bit segments these prefixes would force things to 32 bits)
Lab: InstructionPrefixes.c • More looking at and playing with the various prefixes
That’s what you learned! :D Madness no more! This isn’t so bad!!!
Friends we’ve met along the way • CPUID – Identify CPU features • PUSHFD/POPFD – Push/Pop EFLAGS • SGDT/LGDT – Store/Load GDTR • SLDT/LLDT – Store/Load LDTR • RDTSC – Read TimeStamp Counter • MOV CR, r32 – (CR = Control Register) • MOV r32, CR – (CR = Control Register) • INVLPG – Invalidate page entry in TLB • SIDT/LIDT – Load/Store IDTR • STI/CLI – Set/Clear Interrupt Flag(IF)
More Friendly Friends! • STR/LTR – Load/Store Task Register (TR) • UD2 – Undefined Instruction Interrupt • INTO – Overflow Interrupt • INT n – Software Interrupt, invoke handler n • 0xCC form of INT 3 – Breakpoint Interrupt • IRET – Return from interrupt • MOV DB, r32 (DB = Debug Register) • MOV r32, DB (DB = Debug Register) • IN/OUT – Input/Output Port IO • LOCK prefix (if we had time for prefixes)