Download
1 / 70
700 likes | 708 Views
GlycoTest Range: 30-100 Avg: 75 ; Mean:81. Glyco-challenged Glyco-literate. GlycoAnalytics. Complex Carbohydrate Research Center, Department of Biochemistry & Molecular Biology University of Georgia. Compositional Analysis Using Derivitized Glycans often done by GLC Separation

E N D
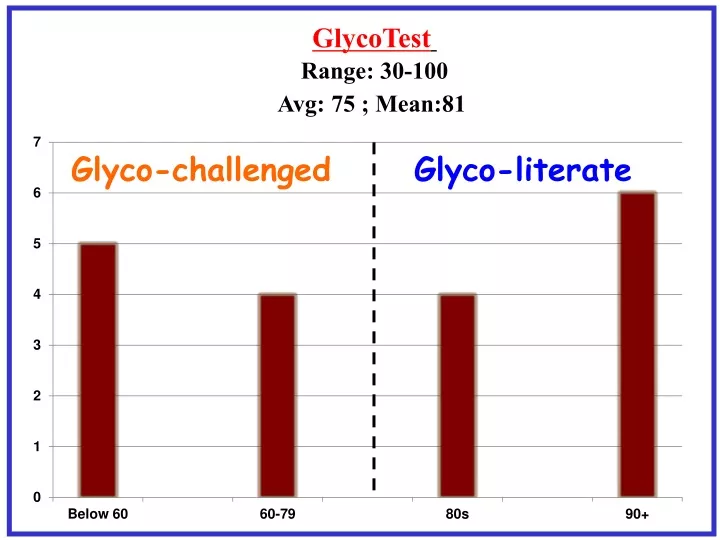
GlycoTest Range: 30-100 Avg: 75 ; Mean:81 Glyco-challenged Glyco-literate
GlycoAnalytics Complex Carbohydrate Research Center, Department of Biochemistry & Molecular Biology University of Georgia
Compositional Analysis Using Derivitized Glycans often done by GLC Separation —Azadi Summer Course
GLC/GC Analysis --Also taught in Azadi’s Summer Courses
NCRR Biomedical Glycomics Tandem Mass Spectrometry-Based Approaches For the Characterization of Glycopeptides
Biological/Technical Challenges • Glycosylation is a non-template driven process • Many building blocks are isomers/epimers • Not one single linkage of building blocks to one another • Majority of glycans are non-linear (branched) • Free glycans are extremely hydrophilic • Microheterogeneity is the norm on glycoproteins • Glycosidic linkage to amino acid is labile
Glycan Capping Reactions http://www.ccrc.uga.edu/~moremen/glycomics/
Site Mapping and Characterization-Glycans, N-linked Sites, O-linked Sites P M Q N G S W E K A F S D Y P R S T P G L C N A I H T C I G R E S S Q L N S V K M
Glycan Release/Permethylation of Glycans • Trypsin digestion of protein • Enzymatic release of N-glycans • b-elimination for O-linked- additon of NaOH • resulting in release of glycan structure from hydroxyl of Ser or Thr • Reduction with NaBH4 prevents re-attaching of glycan • Permethylation of glycan- OH→OMe • Addition of MeI • Analyzed permethylated glycans by applying MSn fragmentation as needed to completely determine the structure J. Am. Chem. Soc. (2003) 125(52): 16213-9.
729.5 2 5 M a r 3 1 M # 2 1 8 3 R T : 3 5 . 9 4 A V : 1 N L : 1 . 5 6 E 7 T : + c N S I F u l l m s [ 3 5 0 . 0 0 - 1 7 5 0 . 0 0 ] 7 2 9 . 5 1 0 0 9 5 542.5 5 4 2 . 8 9 0 Peptide mixtures 8 5 HPLC 8 0 7 5 TurboSEQUEST Cross-Correlation Comparison Database 7 0 1082.7 6 5 1 0 8 2 . 7 6 0 Protein 5 5 Nucleotide ESTs 5 0 4 5 4 0 3 5 3 0 2 5 2 0 1486.1 1 5 1 4 8 6 . 1 1 0 Capillary Column Buffer A 5 Buffer B 0 4 0 0 5 0 0 6 0 0 7 0 0 8 0 0 9 0 0 1 0 0 0 1 1 0 0 1 2 0 0 1 3 0 0 1 4 0 0 1 5 0 0 1 6 0 0 1 7 0 0 LTQ ion trap Mass spectrometer Predicted MS/MS Nsi Peptides sequenced, Proteins Identified 1. Enolase EEALDLIVDAIK 2. P yruvate kinase NPTVEVELTTEK 3. Hexokinase IEDDPFVFLEDTDDIFQK 4. Hypusine APEGELGDSLQTAFDEGK 5. BMH1 QAFDDAIAELDTLSEESYK MS LC-nSI/MS/MS or Direct Infusion Automated MS/MS CID MS/MS
Relative quantification between 2 samples of released and permethylated N-glycans via isotope labeling with light/heavy iodomethane
+1 Dalton J. Proteome Res., 2009, 8 (8), pp 3816–3823
Heavy Medium Light Medium Amide-14N L-glutamine “Gln-14” Amide-15N L-glutamine “GLN-15” Harvest & Combine Homogenization and delipidation Mixed Protein Powder Tryptic digestion Peptide Mixture C18 reverse phase PNGase F digestion -elimination N-linked Glycan Mixture O-linked Glycan Mixture C18 reverse phase Permethylation Deionization Permethylation Permethylated Glycans Permethylated Glycans Mass Spectrometry Heavy GLN-15 Light Gln-14 Quantification by Full MS Characterization by MS/MS
hDE = 1.74 hES 1705 1706 1707 1708 1709 1710 1711 1712 Figure 5 A. [M+Na]+: 1705.862 and 1706.854 m/z (mono) * * 1709.847 * * 100 : 90 1705.858 1710.849 80 70 1706.862 60 Relative Abundance 50 40 1711.852 1707.865 30 20 1708.859 10 0 1713 1714 m/z
100 90 hDE 80 = 0.23 hES 70 60 50 40 30 20 10 0 1431 1432 1433 1434 1435 1436 1437 1438 1439 1440 Figure 5 B. [M+Na]+: 1432.741 and 1435.735 m/z (mono) 1432.736 * * : * 1433.738 Relative Abundance 1434.739 1435.729 1436.729 1437.733 1438.736 m/z
Table 3: Relative quantification of O-glycan expression levels in hESCs and hDE using IDAWG (Ratio=hDE/hESCs) (Prevalence > 1%)
Pulse-Chase experiment designed for dynamic IDAWG Heavy Media Light Media Light Media Light Media X 4 X 3 X 2 X 1 X 1 X 1 X 1 X 4 X 1 Complete Labeling 0 hr 12 hr 24 hr 36 hr Harvest Release N- and O-linked glycans Permethylation
1255 1256 1257 1258 1259 1260 1261 1262 0hr-- >95% Heavy 1259.622 100 95 90 85 80 75 70 65 60 1260.626 Relative Abundance 55 50 45 40 35 30 25 1261.628 20 15 10 1258.626 1262.632 5 0 1263 1264 m/z
1255 1256 1257 1258 1259 1260 1261 1262 6hr 1259.626 100 95 90 85 80 75 70 65 1260.629 60 Relative Abundance 55 50 45 40 1258.631 35 30 1257.633 25 1261.632 20 15 1256.635 10 1262.635 5 0 1263 1264 m/z
1255 1256 1257 1258 1259 1260 1261 1262 12hr 1259.622 100 95 90 85 80 1257.629 75 70 65 1258.629 60 1256.630 1260.625 55 Relative Abundance 50 45 40 35 30 25 1261.627 20 15 10 1262.628 5 0 1263 1264 m/z
1255 1256 1257 1258 1259 1260 1261 1262 24hr 1256.630 100 1257.631 95 90 85 80 75 70 65 60 Relative Abundance 55 50 1258.631 45 40 35 1259.621 30 25 1260.624 20 15 1261.627 10 1262.633 5 0 1263 1264 m/z
1255 1256 1257 1258 1259 1260 1261 1262 36hr 1256.629 100 95 1257.630 90 85 80 75 70 65 60 Relative Abundance 55 50 45 1258.631 40 35 30 25 20 1259.622 15 1260.623 10 1261.626 5 1262.626 0 1263 1264 m/z
50% degradation time and proportion of remodeling at 50% degradation time for 9 major O-glycans
Site Mapping and Characterization-Glycans, N-linked Sites, O-linked Sites P M Q N G S W E K A F S D Y P R S T P G L C N A I H T C I G R E S S Q L N S V K M Focus on Site-Mapping
PNGase F Treatment and N-linked Glycosylation Site-mapping N-X-S/T Secreted Proteins from Adipocytes (insulin responsive vs insulin resistant) Sulfated glycoprotein 1 precursor (SGP-1) gi|3914939 (K)TVVTEAGNLLKDN#ATQEEILHYLEK(K)FSELIVNN#ATEELLVK (K)LVLYLEHNLEKN#STKEEILAALEK lipoprotein lipase gi|12832783 (R)TPEDTAEDTCHLIPGLADSVSNCHFN#HSSK vimentin gi|2078001 (R)QVQSLTCEVDALKGTN#ESLER Follistatin-related protein 1 precursor gi|2498391 (K)GSN#YSEILDK Haptoglobin gi|8850219 (K)VVLHPN#HSVVDIGLIK (K)NLFLN#HSETASAK (K)CVVHYEN#STVPEKK Adipsin gi|673431 (K)LSQN#ASLGPHVRPLPLQYEDK Decorin gi|6681143 (R)ISDTN#ITAIPQGLPTSLTEVHLDGNK Hemopexin gi|1881768 (R)SWSTVGN#CTAALR 56 proteins with 83 N-linked sites
N-linked Site Mapping from ConA-enriched glycopeptides from Drosophila heads--272 sites mapped from197 Proteins Pileup of the 272 N-linked Sites to Determine Consensus beyond N-X-S/T Concerns: PNGaseF/A, Deamidation, C-terminal O-18
PGIP N-linked Site Mapping with PNGase F/A PNGase F (red = coverage) 3 sites identified DLCNPDDKKV LLQIKKAFGD PYVLASWKSD TDCCDWYCVT CDSTTNRINS LTIFAGQVSG QIPALVGDLP YLETLEFHKQ PNLTGPIQPAIAKLKGLKSL RLSWTNLSGS VPDFLSQLKN LTFLDLSFNN LTGAIPSSLS ELPNLGALRL DRNKLTGHIP ISFGQFIGNV PDLYLSHNQLSGNIPTSFAQ MDFTSIDLSR NKLEGDASVI FGLNKTTQIV DLSRNLLEFN LSKVEFPTSL TSLDINHNKI YGSIPVEFTQ LNFQFLNVSYNRLCGQIPVG GKLQSFDEYS YFHNRCLCGA PLPSCK PNGase A (red=coverage) 7 sites identified DLCNPDDKKV LLQIKKAFGD PYVLASWKSD TDCCDWYCVT CDSTTNRINS LTIFAGQVSG QIPALVGDLP YLETLEFHK Q PNLTGPIQPAIAKLKGLKSL RLSWTNLSGS VPDFLSQLKN LTFLDLSFNN LTGAIPSSLS ELPNLGALRL DRNKLTGHIP ISFGQFIGNV PDLYLSHNQLSGNIPTSFAQ MDFTSIDLSR NKLEGDASVI FGLNKTTQIV DLSRNLLEFN LSKVEFPTSL TSLDINHNKI YGSIPVEFTQ LNFQFLNVSYNRLCGQIPVG GKLQSFDEYS YFHNRCLCGA PLPSCK High Stringency Filter
Cell. 2010 May 28;141(5):897-907. Precision mapping of an in vivo N-glycoproteome reveals rigid topological and sequence constraints. Zielinska DF, Gnad F, Wiśniewski JR, Mann M. >6,000 Sites Mapped from Mouse Organs >99% of Sites Match N-X-S/T(C), X is not Pro, ~1% of sites used Cys in place of S/T Small percentage of sites (<1%) were N-X-V or NG (Real of False-Positives???)
O-Glycopeptides GlcNAc Xyl Gal Glc Man Fuc GalNAc b Ser/Thr Ser/Thr Ser/Thr Ser/Thr Hyl Ser Hyp Ser/Thr No PNGaseF equivalent for O-Glycans O-Glycanse has very restricted specificity
Michael Addition Glycan DTT CH2 O H CH2 b-Elimination H CH2 C C N H C N H C C DTT N H C OH- O O O --Can enrich glycopeptides before --Can map via the dehydro-amino acid --Can enrich the peptides after
Michael Addition DTT (d0 or d6) H CH2 C N H C O Differential isotopic tagging of both cysteine and post-translationally modified ser/thr through b-elimination/Michael addition with light (d0) and heavy (d6) DTT. O ICH2 C NH2 S b-Elimination H CH2 C N H C CH2 O C Alkylated Cysteine N H C Light DTT (d0) or Heavy DTT (d6) O OH OH Dehydroalanine (or (GlcNAc or phosphate) HSCd2CdCdCd2SH HSCH2CHCHCH2SH O OH OH b-Elimination H CH2 C N H C O O-GlcNAc or O-phosphate Modified Serine (or threonine) Concerns: Specificity, efficiency, recovery