Download
1 / 16
160 likes | 255 Views
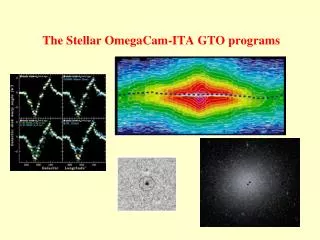
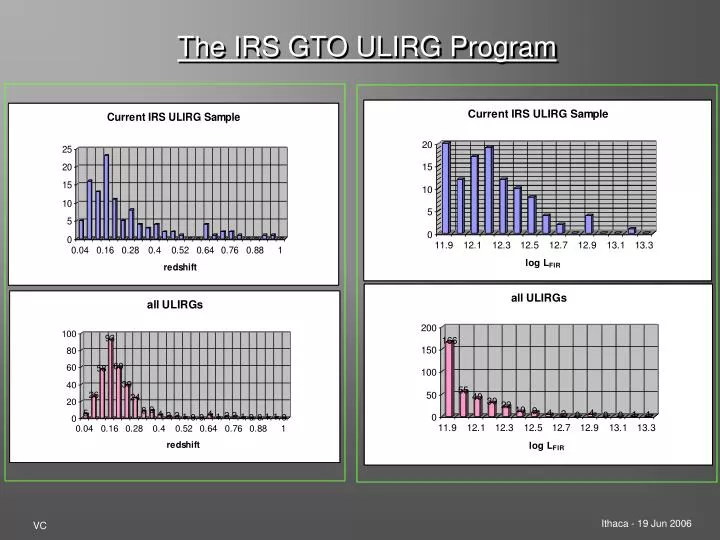
The IRS GTO ULIRG Program. The IRS GTO ULIRG program - details. Of the 110 sources Flux limited: 32 have S 25 0.3 Jy and log L FIR 11.85 L . We are observing all 32 in low and high-res modes. High redshift: 27 have z 0.3.

E N D
The IRS GTO ULIRG program - details Of the 110 sources • Flux limited: 32 have S25 0.3 Jy and log LFIR 11.85 L. We are observing all 32 in low and high-res modes. • High redshift: 27 have z 0.3. GTO1-: 12/27 are being observed in low and high-res. + GTO2 (all rest) • High luminosity: 11 sources have log LFIR 12.5 L. 10/11 are being observed in low and high-res.. • Mix of Far-IR colors: 68 are “cold” (S25/S60 < 0.2) and 21 are “warm”. This is a higher fraction of warm sources than in a flux-limited survey (typically ≤ 10%). • GO Programs: Veilleux et al., Lutz et al., Imanishi et al., Verma et al. Sturtm et al. • Additional IRS spectroscopy of ~30 “Template” galaxies “usual suspects” Weedman et al. 2005, Brandl et al. 2006 (submitted), Devost et al. 2006 (in prep)
AGN Diversity! in the mid-IR spectra of ULIRGs Starburst Embedded
IRS Spectra of BGS Sources Armus et al. 2006 Rigopoulou et al. 1999 ISO PHT-S spectra of BGS Sources
Normalized BGS spectra Armus et al. 2006
Quantifying the contribution • of accretion to a SMBH - • and a Staburst • to the total mid-IR flux • AGN Tracer: • [NeV] at 14.3μm / 23.2μm • (Ep~97eV) • Starburst Tracers: • [NeII] at 12.83μm • (Ep~21eV) • Presence of PAHs • 6.2μm EQW Armus et al. 2006
ULIRG AGN starburst Quantifying the contribution of the energy from the AGN to the total IR luminosity Armus et al. 2006
AGN ULIRG starburst [NeV] not detected in deeply obscured ULIRGs: Is the AGN NLR fully obscured?
AGN thermal emission in mid-IR continuum • Rising slope of thermal emission from the AGN torus from 2-5μm due to grains radiating in near-equilibrium • Excess over starlight at ~4-5μm • “Laurent Diagram” f(5μm)~10Jy z~0.004 D~14Mpc FSC15307+3252 Alonso-Herrero et al. 2003 f(5μm)~7mJy z~0.9 D~5.8Gpc
Decomposition of the Infrared Spectrum • Core of the method • Assume absorption cross sections from Li & Draine (2001) and an MRN grain-size distribution • Calculate the opacities of PAH, graphitic and smoothed astronomical silicate grains. • Each dust component has a quasi-fixed temperature i.e.. the fitting process is really an expansion into several temperature basis components. • The number of dust components is fixed for the sample so that all galaxies are fit in a uniform manner. • In addition to a ~3500 K stellar blackbody and PAH component, we find that we need ~3 additional continuum dust components with T~400, ~150, and ~30 K to accurately fit the entire sample. • An AGN manifests its presence with the requirement of an additional hot dust component T~800K (Laurent et al. 2000) • Talk to Jason Marshall !
Decomposition of Arp220 TCold=31K TWarm=96K THot=873K LHot/LTotal=0.005 L1-40/LTotal=0.19 LPAH/LTotal=0.004
Decomposition of Mrk231 TCold=38K TWarm=151K THot=486K LHot/LTotal=0.13 L1-40/LTotal=0.52 LPAH/LTotal=0.006
Conclusions based on the BGS ULIRGs AGN fraction estimates based on various methods
Quantifying the contribution of the energy from the AGN Using the “Laurent Diagram” Armus et al. 2006