Download
1 / 28
280 likes | 283 Views
Developing a Potential Regional clean fuel standard July 18, 2019. outline. Overview of What We’ve Covered Main Components of Draft Rule Equity Considerations Scal e of Emission Reduction (CI) Regulated/Opt-In Parties: Who Implementation Decisions Cost Containment

E N D
Developing a Potential Regional clean fuel standard July 18, 2019
outline • Overview of What We’ve Covered • Main Components of Draft Rule • Equity Considerations • Scale of Emission Reduction (CI) • Regulated/Opt-In Parties: Who • Implementation Decisions • Cost Containment • Carbon Intensity Scores • Continued Outreach • Air Quality + Health + Economic Impacts • Future Implications • Next Steps
Background Cfs moves Us towards ghg target CAFE freeze
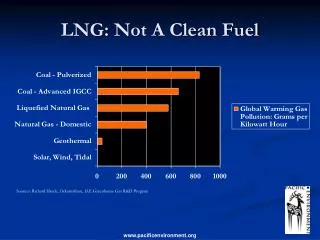
Costs – trucking MD+HD • Diesel and gas vary greatly due to crude
Costs – trucking MD+HD • Diesel price doesn’t track credit price
draft rule Main components
Clean fuel standard: rule overview Article 1: Purpose Article 2: Definitions and Acronyms Article 3: Regulated, Opt-in, and Exempt Fuels Article 4: Regulated and Opt-in Entities Article 5: Carbon Intensity Benchmarks Article 6: Establishing Fuel Pathways Article 7: Credits and Deficits Article 8: Registration and Reporting Procedures Article 9: Validation of Fuel Pathways and Verification of Reports
Main component: equity • Electric Utility Credits • A focus on benefiting underserved communities • Charging infrastructure + rebates + awareness • Transit Agency Credits • A focus on electric transit in underserved communities • Other Equity Opportunities • Backstop Aggregator: EV purchase incentives + chargers • Incentives: transition commercial diesel trucks to EVs • Environmental Justice Advisory Committee • Other Agency Transportation and Equity Strategies (TBD)
Main component: scale of emission reduction (CI) • Staff Recommendation • All-In (Scenario D) level of compliance • Target is ramped and increases faster in out years • About 25% CI reduction target in 2030
Main Component: Emission reductions (CI)Cfs moves Us towards ghg target CAFE freeze CFS Scenario D
Electricity Opt-IN credit generation • EV Charging Station Owners • Transit Agencies – Electric Buses+ Light Rail • Electric Utilities – Residential EV Charging • Shore-power Infrastructure Owners • Electric Cargo Handling Equipment Owners • Electric Forklift Owners • Public and Private EV Fleet Owners
Implementation Decisions • Carbon Intensity Scores • Electricity Carbon Intensity • Utility specific vs. grid average
Implementation Decisions • Carbon Intensity Scores • Indirect GHG Emissions • GHG Indirect Land Use Change (iLUC) • Corn ethanol CA vs. OR • Palm biodiesel generates more deficits than fossil diesel
implementation decisionsCost Containment: Credit Clearance Market • Provides compliance flexibility • Only used if regulated party does not meet compliance obligation. • Increases market certainty regarding maximum compliance costs • Strengthens incentives to invest in and produce low-CI fuels • Reduces probability of credit shortfalls and price spikes • Maximum price for credits is $200, plus inflation
Continued outreach • Health Boards • Kitsap, Snohomish, Tacoma-Pierce (scheduled) • Electric Utilities • SnoPUD, City Light, PSE, Tacoma Power, Lakeview Light/Power • Local + Transit Agencies • Kitsap, King, Snohomish, & Pierce (Counties + Cities), Port of Seattle, Community Transit • Economic Interests • Economic Alliance Snohomish County, Automobile Manufacturers Association, Tesla, National Biodiesel Board, WA Trucking Association, WSPA, Tacoma Chamber (scheduled) • Policy Interests • Environmental Law Institute, UC Davis, Climate Solutions • Environmental + Equity Interests • Front &Centered, Got Green, Puget Sound Sage, WEC, Transportation Choices
Air Quality +Health impacts Pyramid of Air Pollution Effects • Using standard impacts analysis approach • Early death from fine particles drives the overall impact value • Numerous other impacts (asthma, etc.) and other pollutants, not in initial analysis > 90% of monetized value Death 10x 100x 1000x severity of impact number of people impacted https://www.epa.gov/sites/production/files/2014-10/benmappyramid.png
Air Quality + Health impacts Distribution of improvements • Biggest reductions occur in hardest hit areas, near-road, industrial/ trucking areas • Environmental justice statistical analysis pending (by PSCAA) • Will look at benefits across census block groups with respect to income, education, and other socio-economic factors
Transition to Economic Impacts • ICF SLIDES HERE
CFS Implications:what does the future look like? 2022 • Emissions reductions begin • More EVs, more EV charging options, on-the-hood discounts • Fleets can buy more biofuels • More biofuels being produced • Electrical grid continues to get cleaner • Fossil fuel price impact negligible
Implicationswhat does the future look like? 2025 • Emissions continue to decrease • Many more EVs, many more EV charging options • EV drivers save substantial $$ in fuel and maintenance • Electrical grid continues to get cleaner • Even more biofuels being produced • Biodiesel is the new norm, diesel pollution drops • Heavy duty EVs and FCVs reach more segments • Fossil fuel prices might be slightly higher
Implicationswhat does the future look like? 2030 • Region achieves GHG goals as transportation carbon intensity is reduced by 25% along with other measures • EVs are the new norm, used EVs are affordable, many EV charging options • Nearly half of all individuals/households pay less for transportation because they have one or more EVs or hybrids • A lot fewer polluting vehicles on the road, emissions have dropped • Fossil fuel prices likely higher, EV owners don’t notice, a blip for hybrid drivers • Fleets saving substantial dollars by using EVs and FCVs
Timeline and Next Steps • August: Release of Draft Rule – Public Comment Begins • October 7: Public Hearing • November 21: Joint Board/Advisory Council Meeting • December 19: Board Meeting – Potential Board Action