Download
1 / 1
10 likes | 79 Views
Determinants of Vendor Success in Farmers’ Markets: Evidence from Upstate New York*. Todd M. Schmit and Miguel I. Gómez Department of Applied Economics and Management, Cornell University

E N D
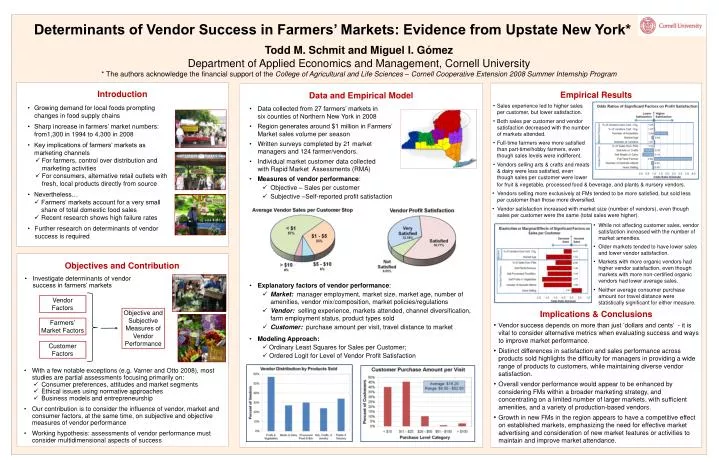
Determinants of Vendor Success in Farmers’ Markets: Evidence from Upstate New York* Todd M. Schmit and Miguel I. GómezDepartment of Applied Economics and Management, Cornell University * The authors acknowledge the financial support of the College of Agricultural and Life Sciences – Cornell Cooperative Extension 2008 Summer Internship Program Introduction Empirical Results Data and Empirical Model • Growing demand for local foods prompting changes in food supply chains • Sharp increase in farmers’ market numbers: from1,300 in 1994 to 4,300 in 2008 • Key implications of farmers’ markets as marketing channels • For farmers, control over distribution and marketing activities • For consumers, alternative retail outlets with fresh, local products directly from source • Nevertheless… • Farmers’ markets account for a very small share of total domestic food sales • Recent research shows high failure rates • Further research on determinants of vendor success is required • Data collected from 27 farmers’ markets in • six counties of Northern New York in 2008 • Region generates around $1 million in Farmers’ • Market sales volume per season • Written surveys completed by 21 market • managers and 124 farmer/vendors. • Individual market customer data collected • with Rapid Market Assessments (RMA) • Measures of vendor performance: • Objective – Sales per customer • Subjective –Self-reported profit satisfaction • Explanatory factors of vendor performance: • Market: manager employment, market size, market age, number of amenities, vendor mix/composition, market policies/regulations • Vendor: selling experience, markets attended, channel diversification, farm employment status, product types sold • Customer: purchase amount per visit, travel distance to market • Modeling Approach: • Ordinary Least Squares for Sales per Customer; • Ordered Logit for Level of Vendor Profit Satisfaction • Sales experience led to higher sales per customer, but lower satisfaction. • Both sales per customer and vendor satisfaction decreased with the number of markets attended. • Full-time farmers were more satisfied than part-time/hobby farmers, even though sales levels were indifferent. • Vendors selling arts & crafts and meats & dairy were less satisfied, even though sales per customer were lower • for fruit & vegetable, processed food & beverage, and plants & nursery vendors. • Vendors selling more exclusively at FMs tended to be more satisfied, but sold less per customer than those more diversified. • Vendor satisfaction increased with market size (number of vendors), even though sales per customer were the same (total sales were higher). • While not affecting customer sales, vendor satisfaction increased with the number of market amenities. • Older markets tended to have lower sales and lower vendor satisfaction. • Markets with more organic vendors had higher vendor satisfaction, even though markets with more non-certified organic vendors had lower average sales. • Neither average consumer purchase amount nor travel distance were statistically significant for either measure. Objectives and Contribution • Investigate determinants of vendor success in farmers’ markets Vendor Factors Objective and Subjective Measures of Vendor Performance • Implications & Conclusions • Vendor success depends on more than just ‘dollars and cents’ - it is vital to consider alternative metrics when evaluating success and ways to improve market performance. • Distinct differences in satisfaction and sales performance across products sold highlights the difficulty for managers in providing a wide range of products to customers, while maintaining diverse vendor satisfaction. • Overall vendor performance would appear to be enhanced by considering FMs within a broader marketing strategy, and concentrating on a limited number of larger markets, with sufficient amenities, and a variety of production-based vendors. • Growth in new FMs in the region appears to have a competitive effect on established markets, emphasizing the need for effective market advertising and consideration of new market features or activities to maintain and improve market attendance. Farmers’ Market Factors Customer Factors • With a few notable exceptions (e.g. Varner and Otto 2008), most studies are partial assessments focusing primarily on: • Consumer preferences, attitudes and market segments • Ethical issues using normative approaches • Business models and entrepreneurship • Our contribution is to consider the influence of vendor, market and consumer factors, at the same time, on subjective and objective measures of vendor performance • Working hypothesis: assessments of vendor performance must consider multidimensional aspects of success