Download
1 / 56
690 likes | 982 Views
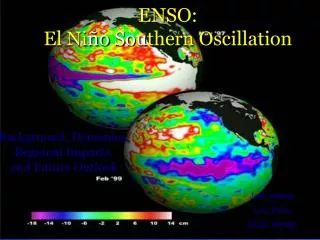
ENSO El Ni ñ o- Southern Oscillation. El Ni ñ o- Southern Oscillation (ENSO). Interactions, inter-relationships between: Atmospheric circulation Ocean circulation Climate El Ni ñ o- oceanic component Southern Oscillation- atmospheric component. ENSO. El Ni ñ o

E N D
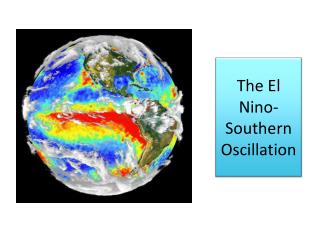
ENSO El Niño- Southern Oscillation
El Niño- Southern Oscillation (ENSO) • Interactions, inter-relationships between: • Atmospheric circulation • Ocean circulation • Climate • El Niño- oceanic component • Southern Oscillation- atmospheric component
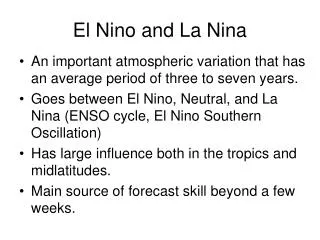
ENSO • El Niño • Named for anomalous warm current off Peru • Tends to occur around Christmas time • Intensity and duration - variable
ENSO • Southern Oscillation • Oscillation is the distribution and intensity of high and low pressure systems across the equatorial Pacific • Affects wind patterns • Affects surface ocean circulation patterns • Affects climate
January Indonesian Low East Pacific High KKC 5-19
ENSO • El Nino-Southern Oscillation Name given to a series of conditions that focus on processes in the Equatorial Pacific, but have global consequences
Atmospheric Circulation - Eq Pac • Walker Cell • East to west atmospheric circulation cell • Superimposed on the Hadley cell • Similar to Hadley cell, but follows lines of latitude instead of lines of longitude
Atmospheric Circulation - Eq Pac • Walker cell • Normally initiated at the Indonesian Low • Indonesian Low • Low pressure system near Indonesia/Australia • Overlying the western Pacific warm pool
January Indonesian Low East Pacific High KKC 5-19
Walker Cell Darwin Indonesian Low Tahiti East Pac High KKC 15-12
Walker Cell • Air rises over Indonesian Low • Transported to the east aloft • Sinks in eastern equatorial Pacific (at high pressure) • Transported to west at ground level = Trade winds • Discovered by British mathematician in 1900’s studying failure of the Indian monsoon
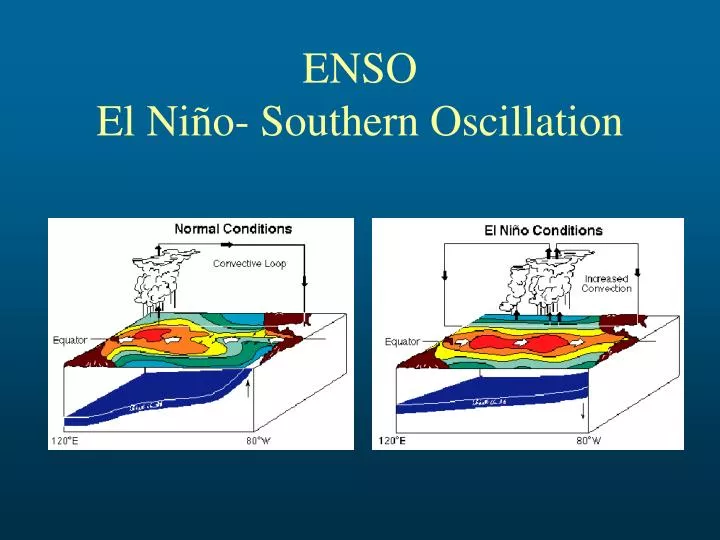
Normal Conditions = Walker cell From NOAA website (see KKC 15-13a)
Normal Conditions • Low Pressure over Indonesia • High Pressure over eastern equatorial Pacific • Strong Walker cell • Strong Trade winds • Weak Equatorial Counter Current • Upwelling near Peru • Western Pac ~8 warmer than eastern Pac • Sea surface about 0.5 m higher near Indonesia • Rain in western Pac/dry in eastern Pac • Thermocline ~100m in western Pac, 15-50 m in eastern Pac
Normal Conditions Garrison’s Oceanography text, 8-15a
Normal Conditions Green = cold Red = warm Sea Surface Temperature (SST) Garrison 8-15b
Normal Conditions Sea Surface Temperature (SST) Anomalies NOAA site
El Niño Conditions • Decreased pressure gradient across the equatorial Pac • Weakening of Walker cell • Weakening of Trade winds • Stronger Equatorial Counter Current • Migration of warm pool to the east • Reduced upwelling and deepening of the thermocline in the east • Shift in rainfall to the east • Eastward displacement of atmospheric heat source (and associated global climate changes)
El Niño Conditions From NOAA website (see KKC 15-13b)
El Niño Conditions • Weakening of Walker • Decreased pressure gradient • Weaken Trade winds • Stronger Eq Counter Current • Migration of warm pool • Reduced upwelling (east) • Shallower thermocline (west) • Shift in rainfall to the east Garrison 8-15c
El Niño Conditions Garrison 8-15d
Comparison El Nino Normal Garrison 8-15
El Niño Conditions Sea Surface Temperature (SST) Anomalies NOAA site
Comparison- SST Anomaly Normal El Nino NOAA site
Development of El Niño Red and white = sea level above normal White = sea level 30 cm above normal ~3 C above normal Garrison
ENSO Pattern • Tend to develop during April – June • Maximum Strength in Dec. – Feb. • Persist 9-12 months (up to 2 yrs) • Recur every 2-7 yrs
Simulations • http://esminfo.prenhall.com/science/geoanimations/animations/26_NinoNina.html
Effects on Upwelling Reduced upwelling = fewer nutrients = less food at bottom of the food chain
Effects of Upwelling Collapse of Peruvian anchovy industry
La Niña • Reverse of ENSO conditions • Stronger trades • Stronger Walker cell • More convection over Indonesia • Shallower thermocline to the east • Increased upwelling near Peru • Cooler eastern Pacific • Typically follow El Ninos, but less common
La Niña El Niño
El Nino Animations Comparisons of El Ninos (and La Ninas http://www.elnino.noaa.gov/ani.html Current conditions http://www.cpc.ncep.noaa.gov/products/analysis_monitoring/enso_update/sstanim.shtml
Southern Oscillation Index (SOI) • Oscillation in atmospheric pressure across the Pacific • Measure of intensity of ENSO • Contrast • Western Pac vs. eastern Pac • Indonesian Low vs. So. Pac high • Darwin, Australia vs. Tahiti
Southern Oscillation Index (SOI) • 0 = normal conditions • Negative • Darwin higher than normal • Tahiti lower than normal = ENSO • Positive • Darwin lower than normal/Tahiti higher = La Niña
Southern Oscillation Index (SOI) Similar to KKC 15-17
Record of ENSO El Nino La Nina • Multivariable index: • Sea level pressure • Zonal and meridional surface winds • SST • Surface air temperature • Total cloudiness http://www.cdc.noaa.gov/ENSO/enso.mei_index.html
ENSO Frequency • Quasi Periodic • Every 2-7 years • Coral records • ~1 event every 4 years and 1 strong event per decade for past century • Duration and extent varies- each ENSO is unique • 1990-1995 = prolonged ENSO conditions
Coral Records of ENSO La Niña El Niño
* * * * * * * Seasonal cycle Variations between events
ENSO Comparison http://www.cdc.noaa.gov/people/klaus.wolter/MEI/#ElNino
Cause(s)? • Probably internal to climate system • Timing ocean/atmosphere dynamics • ~surface ocean response times • Driving energy = Pacific warm pool • Random/chaotic aspects- noise in the climate system
ENSO Teleconnections • Global Effects (based on statistical correlation) • Large scale disturbance of convergence zones in the Tropics (impacts Hadley cells) • Impact on the Indian monsoon- reduced moisture source • Drought in Australia and Africa • Heavy rain in Peru/Calif
ENSO Teleconnections • Global Effects • Shift in tropospheric subtropical jet stream- driven by equator to pole gradient (ENSO = steeper gradient) • Florida- cool, wet winters • NW and NE N. America- warmer (snowier) • More Pacific tropical storms • Fewer Atlantic and Gulf tropical storms
Teleconnections NOAA website, see KKC 15-18
Teleconnections La Nina El Nino COAPS Website - Center for Ocean - Atm Prediction Studies
ENSO and Hurricanes Tang, B. H., and J. D. Neelin, 2004: ENSO Influence on Atlantic hurricanes via tropospheric warming. Geophys. Res. Lett.: Vol 31, L24204.
ENSO and Hurricanes • ENSO conditions tend to suppress development of tropical storms/hurricanes in the Atlantic (inc. number in Pacific) • Wind shear • Drier conditions during hurricane season http://ww2010.atmos.uiuc.edu/ (Gh)/guides/mtr/hurr/enso.rxml University of Illinois- World weather 2010 project
La Nina Teleconnections • More rain Indonesia/Australia (Phillipines) • Droughts US south and southwest • More rain US northwest • Increased hurricane activity • Florida- warm, dry winter