Download

1 / 32
320 likes | 422 Views
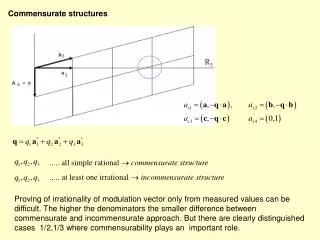
Analysis of Non-commensurate Outcomes. Armando Teixeira-Pinto AcademyHealth, Orlando ‘07. Agenda. Introduction Example: HRQOL after intensive care Common approach to multiple outcomes The latent variable model HRQOL results Discussion and summary. The city of PORTO. The city of PORTO.

E N D
Analysis of Non-commensurate Outcomes Armando Teixeira-Pinto AcademyHealth, Orlando ‘07
Agenda • Introduction • Example: HRQOL after intensive care • Common approach to multiple outcomes • The latent variable model • HRQOL results • Discussion and summary
Introduction • Multiple outcomes are often collected in health studies • Longitudinal data, repeated measurements, multiple informants, multi-dimension outcome (health related quality of life), multiple surrogates for an outcome of interest • Typically these outcomes are correlated. • For outcomes measured in the same scale there are several multivariate methods implemented in commercial software • Generalized linear mixed model, GEE, GLM, MANOVA…
Introduction • Often the outcomes are non-commensurate (mixed type) as for example a binary and a continuous outcome • Common approach: • Analyze each outcome separately (univariate framework) ignoring the correlation • A multivariate approach will: • Use the additional information contained in the correlation between outcomes • Permit better control over Type I error rates • Answer intrinsically multivariate questions • Be helpful in some situations of missing data
Motivation example Quality of life after Intensive Care • Objective: evaluate health related quality of life (HRQOL) of patients 6 months after ICU discharge. • Study the association with: • Age • Previous health state • Non-chronic disease • Chronic disease with no disability • Chronic disease with disability • Apache II score • Severity score at ICU admission
Instrument EQ-5D Measuring HRQOL • EQ-5D is a standardized instrument for use as a measure of health outcome. • Applicable to a wide range of health conditions and treatments, it provides a simple descriptive profile and a single index value for health status based on 5 health related dimensions. • Includes a question about patient’s perception of his/hers HRQOL
Instrument EQ-5D • We’ll consider two outcomes • EQ-5D index • Summarizes the 5 dimensions of the EQ5D • Continuous outcome • D-VAS (visual analogue scale) • VAS Dichotomized <=50 and >50 • Binary outcome • And the three covariates: • Age ; Previous health state; Apache II
Common approach • Data for the HRQOL after ICU stay: • 4 years of data collection • One intensive care unit from a tertiary hospital in Portugal • 485 patients participated in the study • The EQ-5D index was available for all the patients • Only 366 patients answered the question associated with the D-VAS • Common approach: • Linear model for the EQ-5D index • Logistic or probit regression for D-VAS
Multiple outcomes age EQ-5D index previous health state n=485 Apache II age D-VAS previous health state n=366 Apache II
Multiple outcomes age EQ-5D index previous health state n=485 Apache II age D-VAS previous health state n=366 Apache II
Why should we use a multivariate method? • Missing values of D-VAS are associated with lower HRQOL • For a separate model for D-VAS we have missing not a random (MNAR) and the regression estimates might be biased • Because the two outcomes are correlated, in a joint model, we can ‘borrow’ information from the EQ-5d index and reduce the bias for the estimates associated with D-VAS
Multiple outcomes • If the outcomes are of the same type, we could assume a multivariate distribution for the outcomes • For example, two continuous outcomes
Binary and continuous outcomes • For mixed type of outcomes there is no obvious multivariate distribution • Strategy: Avoid direct specification of the joint distribution • Latent variable model for yb, yc • Introduce a latent variable, u, and assume that conditional on u the outcomes are independent f(yb, yc)= f(yb, yc ,u)du = = f(yb, yc |u) f(u) du = f(yb |u) f(yc| u) f(u) du
Binary and continuous outcomes • Latent variable model f(yb |u) f(yc| u) f(u) du • We can specify separate equations for the outcomes conditional on u. • The latent variable is modeling the correlation between the outcomes
Latent model • Mathematically speaking: • band c are scale factors “adjusting” the latent variable to the different scales of the outcomes
Latent model • However this models has parameters that are non-identifiable and we have to fix some of them • It can be shown that the correct way to fix some of the parameters is:
Latent model • IMPORTANT NOTE: The models are for yb |u and yc |u . I omit the conditional from the equations for simplification. • The interpretation of b ’sreferring to the effect of the covariates on the outcome yb is conditional on u, i.e., yb|u • The ‘marginal’ effect can be obtained:
Latent model • The same is true for c ’s, but because of the linear link the interpretation is the same for yc |u and yc • A nice feature of this model is that it can be easily implemented in commercial stats software • With SAS, use PROC NLMIXED
SAS code to fit the Latent Model #SAS code to maximize the likelihood resulting from the latent variable model for the HRQOL example; proc nlmixed data=Icu.Euroqolreduced technique=newrap; #initial values; parms a1=-0.9 b1=.02 c1=-1 d1=0 a2=104 b2=-.2 c2=-9 d2=-4 sigmau=1 sigma2=15 ; bounds sigma2>0, sigmau>0; #likelihood; part1=a1 + b1*age + c1*apache +d1*pstate+ u; part2=eq5d - (a2 + b2*age +c2*apache + d2*pstate) - u*sigma2; if missing(dvas) then loglik=-log(sigma2)-.5*1/(sigma2**2)*(part2)**2; else loglik =dvas*log(PROBNORM (part1))+(1-dvas)*log(PROBNORM (-part1))-log(sigma2) -5*1/(sigma2**2)*(part2)**2; #model (actually you can put any variable other than eq5d with complete observations; model eq5d ~ general(loglik) ; random u ~ normal(0,sigmau**2) subject=idnumb; #computes the ‘marginalized’ parameters for the probit model; estimate ‘intercept' a1/sqrt(1+sigmau**2); estimate 'age_marg' b1/sqrt(1+sigmau**2); estimate 'apache_marg' c1/sqrt(1+sigmau**2); estimate ‘pstate_marg’ d1/sqrt(1+sigmau**2); run;
Results of the HRQOL study • The analysis suggests that the severity of the episode leading to the ICU admission is associated with the patients perception of his/hers HRQOL but not with the EQ-5D index • This effect would not be noticed with univariate analysis • Taking into account the correlation between the two outcomes (crude = 0.42) helped to reduce the bias of the effects estimates
Other approaches Other strategies presented in the literature: • Factorization method: • f(yb, yc) = f(yb)f(yc| yb) or • f(yb, yc) = f(yc)f(yb| yc) • Extension of weighted GEEs to non-commensurate outcomes • Other strategies for the missing data can also be used, e.g., multiple imputation
Extention to more than two outcomes For k outcomes:
“Take home” message Univariate approach Multivariate approach Complete cases + Same covariates for all the outcomes Complete cases + Different covariates for the the outcomes Univariate approach less efficient (larger std. errors) Multivariate approach more efficient (smaller std. errors) Univariate approach may lead to biased estimates Multivariate approach may reduce the bias Missing data on the outcomes
Thank you for your attention! Slides available at: http://users.med.up.pt/tpinto/ahealth.ppt