Download
1 / 29
290 likes | 294 Views
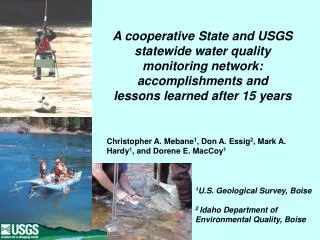
A cooperative State and USGS statewide water quality monitoring network: accomplishments and lessons learned after 15 years. Christopher A. Mebane 1 , Don A. Essig 2 , Mark A. Hardy 1 , and Dorene E. MacCoy 1. 1 U.S. Geological Survey, Boise 2 Idaho Department of Environmental Quality, Boise.

E N D
A cooperative State and USGS statewide water quality monitoring network: accomplishments and lessons learned after 15 years Christopher A. Mebane1, Don A. Essig2, Mark A. Hardy1, and Dorene E. MacCoy1 1U.S. Geological Survey, Boise 2 Idaho Department of Environmental Quality, Boise
opportunities to excel Some difficulties with maintaining a long-term statewide monitoring network • It often takes a long time to get meaningful trend data • Things change: • Priorities change – • “Classic” chemical-based WQ measures to bioassessment to integrated assessment • Water quality standards change (bacteria, dissolved metals, fish tissue based water quality criteria for mercury • Antidegradation to TMDLs • Stakeholder priorities change • Agency staff change • Methods change • Budgets little changed • 1989 ~ $200,000/yr 2006 ~ $230,000/yr
Initial Network Design (1989-1995) • Antidegradation focus • maintaining “high quality” waters which have better quality than that required by numeric criteria • protecting existing aquatic life and recreational beneficial uses of waters • Apparent emphasis on nutrient enrichment in agriculturally influenced waters Photo: Barry Bean, Idaho Power Co.
Initial Network Design (1989-1995) • 56 Sites chosen • “Integrator” sites – located near the outflow of major hydrologic basins • Represent major upstream land uses • Located with existing streamflow-gaging network • Width and depth integrated sample collection; samples representative of channel cross-section at the time of sampling; • bimonthly sampling year-round • Chemical and physical parameters measured • no direct measures of aquatic life uses
Initial Network Design (1989-1995) • Complement other efforts • Built around 7 then-existing sites of the late USGS National Stream Accounting Network (NASQAN) sites , 3 NASQAN sites continued • 3 USGS National Water Quality Assessment (NAWQA) status and trends sites • Annual, biennial, and triennial sample rotation • Annual: active WQ management efforts • Biennial: WQ and land use expected to change slowly • Triennial: Future development concerns • No explicit consideration of reference conditions • Emphasis on maximizing data collection • All budget devoted to data collection, none to interpretation
1996-to date • Mindset change #1 – Use biological data to evaluate biological uses! • Added invertebrate and fish collection • Added reference-like sites • Added continuous temperature loggers • Monthly chemical sampling during April-September • Dropped most chemical sampling (trace metals, pesticides) • Dropped and replaced sites • Mindset change #2 – Data are not self-interpreting • Devoted 1 full year’s budget to data interpretation
Data Availability and Interpretation • Raw data: • 1989-2001 – Published in water-year annual data reports • More recently – Chemical and physical data available via USGS National Water Information System Web site (NWISWeb). • Biological data available through locally administered interactive mapping web site
NAWQA Cycle I – Descriptive studies Biological data are web served
Interpretive Reports Maret and others, 2001 Hardy and others, 2006
Invertebrate river index (IRI) and biological condition categories by site type, 1996-1998
Can monthly sampling be representative of long-term hydrologic conditions? Yes, generally. 1989 1991 1993 1995 1997 1999 2001
Total Nitrogen Patterns Teton River at St. Anthony Rock Creek near Twin Falls Water sample LOWESS smooth line Total Nitrogen (mg/L) Silver Creek near Picabo Marsh Creek near Pocatello
Trace Metals in Fish Tissue, 1996-2000 Metal concentration in liver (mg/kg dry wt.) Metal concentration in liver (mg/kg dry wt.) Range of 2004 EPA water quality criterion EPA 2001 water quality criterion
Fixed-site trends network complements other state monitoring programs • Idaho has a spatially intensive biological and habitat assessment program (>4000 wadable stream sites sampled) • Few sites are sampled more than once • In contrast, the trends network has a temporally rich dataset at relatively few sites Stream sites sampled from 1994-1996 in IDEQ’s beneficial use reconnaissance program (BURP) Environmental Monitoring and Assessment 67: 2001 293-322
Future directions? • Basic design seems reasonably sound • Budget does not keep pace with costs, requires inevitable reduction in effort • We could do a better job of making the monitoring data easier to find and more accessible (although it is quite accessible now) • Future issues that might be important to monitoring: • Mercury in fish • Nutrients remain an important issue • Are possible trends in nutrient concentrations related to changing management practices, physical variables, or chance?
A partial list of those who have contributed to the effort over the years: • Idaho Department of Environmental Quality • Don Essig, Mary Anne Nelson, Michael McIntyre, and Bill Clark (retired) • U.S. Geological Survey • Deb Parliman, Ivalou O’Dell, Dorene MacCoy, Ross Dickinson, Doug Ott, Terry Maret, Bob Reaves, Jake Jacobson, Rick Backsen Mark Hardy and Walton Low. • Presenter: Chris Mebane, cmebane@usgs.gov • Reports and raw data: http://id.water.usgs.gov/