Download
1 / 10
100 likes | 104 Views
Science Fair Second Draft. Read the questions below. Take note of components you need to add to your lab report or improve upon. Make the appropriate revisions and turn in on due date. Revise First Draft. Overall:

E N D
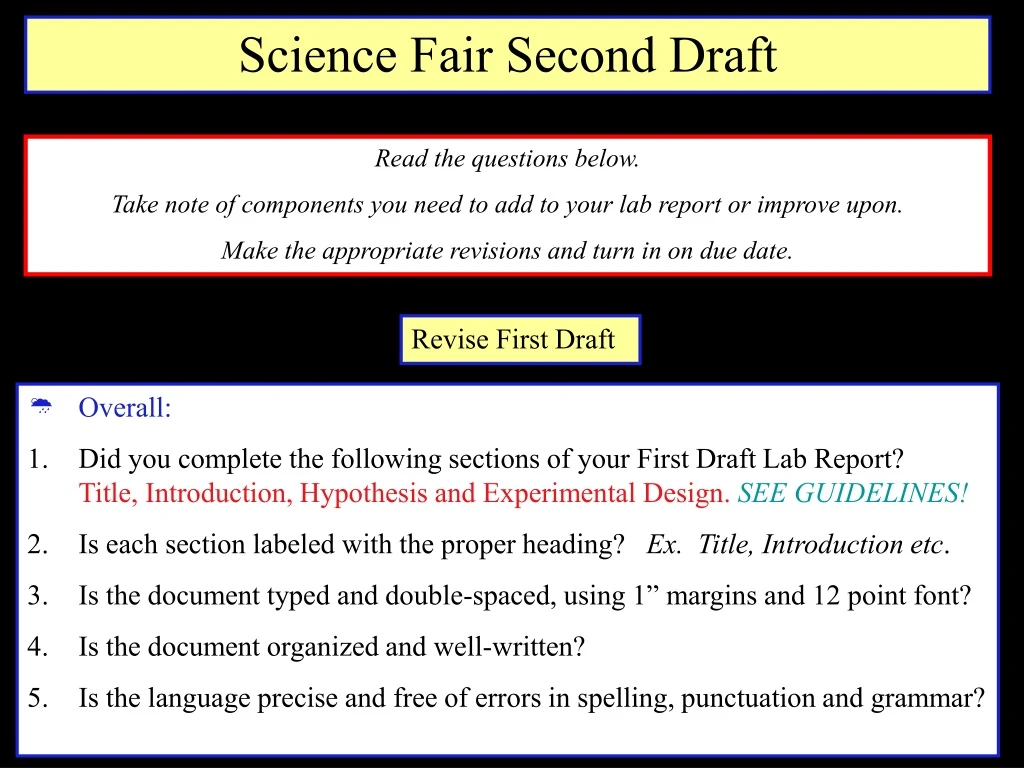
Science Fair Second Draft Read the questions below. Take note of components you need to add to your lab report or improve upon. Make the appropriate revisions and turn in on due date. Revise First Draft • Overall: • Did you complete the following sections of your First Draft Lab Report? Title, Introduction, Hypothesis and Experimental Design. SEE GUIDELINES! 2. Is each section labeled with the proper heading? Ex. Title, Introduction etc. • Is the document typed and double-spaced, using 1” margins and 12 point font? • Is the document organized and well-written? • Is the language precise and free of errors in spelling, punctuation and grammar?
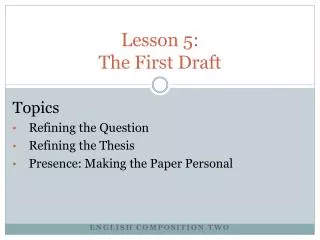
Revise First Draft • Title: • Is the ‘Title’ in the proper format? Ex. The effect of I.V. on D.V. • Is the experiment appropriate and scientifically testable? • Introduction: 1. Is the ‘Introduction’ section at least 3 sections long? (min. of 11/2 pages) • Are citations included in the text using the proper format (author, date)? • Does the first section include extensivebackground information and prior knowledge relevant to your topic? • Does the second section explain what the experiment is designed to test? (The effects of the I.V. on D.V .--underline the experimental purpose). Does the second section explain how the research topic is relevant to the ‘real world’? Did you include motivation, justification, and rationale for doing the study? • Does the third section of the “Introduction” clearly identify the predicted outcomes (hypothesis) of the experiment? • Explain what you think is going to happen! Address each level of the I.V.!
First Draft Revisions • Hypothesis • Is the ‘Hypothesis’ in the proper format? (If…then…) • Does it make a prediction that is specific to at least one of the levels of the IV? • Experimental Design • Note: An ‘Experimental Organizer’ is NOT an Experimental Design! • Somewhere within the body of the text, did you clearly identify and underline the following variables: IV, levels of IV, DV, control and constants? • Identify at least 3 levels of the I.V. and a control • Include multiple trials for each I.V. level • Identify at least 2 different methods of data collection - D.V.(quantitative) and D.V. (qualitative) Experimental Design Cont…
First Draft Revisions • Experimental Design, cont. Does the ‘Experimental Design’ include at least 3 sections using complete sentences? • Does the first section describe all the materials needed to set up and carry out your experiment? • Does the second section describe how to set up the experiment? • Is it written in enough detail that someone unfamiliar with your project could set up this experiment? 3. Does the third section describe how to collect data for the experiment? • Do you use complete sentences? • Is it written in enough detail that someone unfamiliar with your project could collect data for this experiment? • Did you describe methods for collecting quantitative data? • Did you describe methods for collecting qualitative data? • If applicable, did you include a copy of any survey, form or test you are planning on using to collect data? BOTH
Complete your Data Collection • Materials You have gathered the appropriate materials needed to carry out your experiment. • Forms, Surveys and Tests 1. You have created and conducted tests needed for data collection. 2. If applicable, you have photocopied and handed out survey forms to participants in preparation for data collection • If applicable, you have photocopied and handed out informed consent forms to human participants. • Collect these from participants when you do data collection!
Complete Data Presentation and Analysis • Data Tables You should have completed data tables for both qualitative and quantitative data. • Include calculations of central tendency and variation. SEE GUIDELINES! (and next slides) • Include a title; label I.V. and D.V.; appropriate trials. SEE GUIDELINES! (and next slides) • Graphs Complete appropriate graphs for both qualitative and quantitative data. • Include titles, labels, etc. SEE GUIDELINES!(and next slides) • Lab Notebook and Photographs Use: binder paper, camera, colored pencils etc. (This will be submitted with your Final Draft). SEE GUIDELINES! Check in with Mr. Stewart this week about your data!
Complete Data Presentation and Analysis Data Analysis in Microsoft Excel Calculations • Label table and fill in data. • Highlight the cell where you want to add a calculation • 2. Choose “Insert” and then “Function…” from the menu • Select desired calculation(s). (Note: for ‘mean’, select ‘AVG, for standard deviation, select ‘STDEV’). • Highlight the cells with the appropriate data to be analyzed
Complete Data Presentation and Analysis Graphing • Creating the Graph • 1. Highlight data on your data table to appear on the y-axis (the DV). If appropriate, you can also highlight the data for the x-axis (the IV). • Select “Insert”…”Chart” from the menu. Follow the steps for creating the appropriate graph. Graphing Standard Deviation (Y Error Bars): 3. Once your graph is created, double click on one of the data points in the graph. • 4. Choose tab titled “y error bars” from dialogue box • 3. Click on the grid icon next to the window labeled Custom (+).Highlight the cells containing values for standard deviation on your data table. • 4. Click on the grid icon next to the window labeled Custom (-).Highlight the cells containing values for standard deviation on your data table. • 5. Click O.K. Graph of Quantitative Data
Complete Data Presentation and Analysis Graph of Qualitative Data
Discussion, Conclusion--Next Drafts • Discussion, Conclusion Submit with your 3rd and Final Drafts (an outline of your Discussion and Conclusion will be due soon). SEE GUIDELINES! References Cited • References Cited • Are references cited in paper using (Author, Date) format? SEE GUIDELINES! • Are all references listed at end of report according to bibliographic format? SEE GUIDELINES!