Download
1 / 30
300 likes | 310 Views
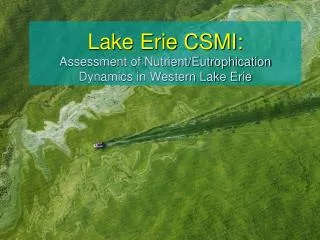
Join the Lake Erie Millennium Network (LEMN) for a research workshop on the urban land and eutrophication linkages in Lake Erie. This workshop aims to clarify research needs and form collaborative groups to address management and monitoring needs.

E N D
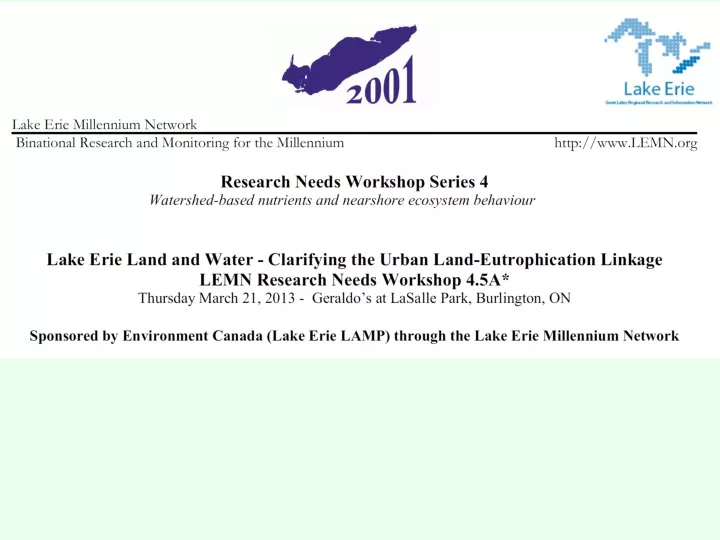
Lake Erie Land and Water - Clarifying the Urban Land - Eutrophication Linkage LEMN Research Needs Workshop 4.5A Thursday March 21, 2013 – Geraldo’s at LaSalle Park, Burlington, ON
Lake Erie Millennium Network (LEMN) http://www.uwindsor.ca/erie2001 Binational Network - formed November 1998 Convening Organizations: F.T. Stone Lab - Ohio State University (Jeff Reutter) NWRI - Environment Canada (Chris Marvin) Large Lakes Research lab - US EPA (Russ Kreis) University of Windsor (Jan Ciborowski) Sponsors:Federal, State, Provincial, Regional organizations Collaborators:Groups active in research/information exchange
Supporting Groups Sponsors Collaborators__ (funds for meetings, publications, etc.) (contribute to data needs, etc.) Essex Region Conservation Authority Citizens Environment Alliance Great Lakes Fishery Commission Cornell University Biological Station International Joint Commission Ducks Unlimited Lake Erie Lakewide Area Management Plan Essex County Stewardship Network through Environment Canada & US EPA Great Lakes Commission Michigan Sea Grant Great Lakes Environ. Res. Lab - NOAA Lake Erie Protection Fund Great Lakes Research Consortium New York Sea Grant Great Lakes Lab Fisheries & Aquatic Ontario Ministry of the Environment Sci. - Fisheries & Oceans Canada Ontario Ministry of Natural Resources Ontario Commercial Fishery Assoc. Pennsylvania Dept. Environmental Protection Ontario Fed. of Hunters & Anglers Pennsylvania Sea Grant Ohio Dept. Natural Resources US Geological Survey - Gt. Lakes Sci. Ctr. Ohio Environ. Protection Agency Ontario Ministry Agriculture & Food Campbell Scientific Water Environment Federation DTE Energy, Inc. Hoskin Scientific
Monitoring Hypothesis testing Modeling Research Questions Status of the Lake Management Needs Forming collaborative groups (open to all) Policy Relationship among management, research, & monitoring needs within LEMN.
Workshops and Research Arising 1. Limits on Energy Transfer in the Lake Erie Ecosystem - Critical Tests of Hypotheses EPA-funded Lake Erie Trophic Status project (2002): -28 PI’s funded by US EPA ($500K) -all agency collaboration $2M in kind support - Journal of Great Lakes Research special issue (June/06) 2. Contaminant Processes in Lake Erie (2000) - Part I. Loadings, Spatial Patterns, and Temporal Trends - Part II. Mechanisms and Processes - Part III. Ecosystem Implications[review papers] 3. Habitat Structure, Function, and Change Anticipating effects of water level changes on habitat distribution & quality in the Huron-Erie Corridor -funded by GLFC; 5 PI’s & cooperators; models proposed (2004) Binational Mapping Strategy for Lake Erie watershed - funded by US EPA & Envir. Cda. (2005/06) -12 PI’s & cooperators - all agency collaboration
Workshops and Research Arising 4. Land-Lake Loadings IJC & OMAFRA Sponsored workshops (2008-2010): -28 PI’s funded by US EPA ($500K) -all agency collaboration $2M in kind support - Journal of Great Lakes Research special issue (June/06) 5. Understanding Causes of Nearshore Eutrophication(2009) - BEC Intensive monitoring year (EPA, EC, MOE, OMNR, etc.) - 7 integrated projects funded by US EPA & LEPF - parallel studies in Ontario - SERA 17 Phosphorus forum 6. Collaborative Research under GLRI (& EC support) (2010) -update landuse/landcover for habitat classification - continuing nearshore research - monitoring wetland condition & ecological services
“Management interventions and causal structure” • To solve a problem, we have to understand the cause • Successful management also requires understanding the causes • Different management strategies can be seen as experiments to assess causes
Fuzzy Cognitive Map (FCM) • A tool for representing the causal structure of a system • Elements include concepts (vertices; boxes) and relation-ships among concepts (arcs; arrows) • The resulting FCM is (formally) a graph, and can be analyzed using various graph-theory techniques. • S. Findlay IJC-Sponsored Workshop February 2009
Original Exercise: Assessing causes of Eutrophication in the Great Lakes (S. Findlay, J. Koonce, J. Ciborowski et al.
9 1 4 5 6 2 3 7 8 10 11 5 18 19a 21 22 23 19b 25 24 12 13 15 17 14 16 26 20 30 28 29 27 36 17 59 31 37 32 38 60 In lake 33 39 34 35 41 44 58 43 42 52 45 57 46 53 47 + 54 48 55 49 56 50 51
Concepts (‘boxes’): Descriptors of the system. Drivers (‘from’ variables) and Receivers (‘to’ variables) Restriction for FCM: Ordinal variables (must have a “size”) Problem Term: “Soil Type” (important variable, but categorical) Solution: Describe ordinal attributes - Soil permeability - Soil carbon content
Procedure for drawing FCM • Review lists of variable (grouped by functional class for convenience) • 2. Select variables (labels) deemed most relevant for your map • Arrange variables to form a flow chart. • If no label exists for a variable, tell a facilitator; we’ll create one or suggest an equivalent variable • Write your team name/number prominently in a corner of the map. • Draw lines/arrows/pathways in pen/pencil from each keyword (label) to other labels (variables) that are directly influenced. The ‘from’ label is considered the ‘driver’ or ‘emitter’; the ‘to’ label is the ‘response’ or ‘receiver’ variable. Draw a directional symbol near the origin of the line. If you think there is a feedback loop between two variables, draw two lines; one going from ‘A’ to ‘B’ and the other going from ‘B’ to ‘A’. • Indicate the ‘sign’ of the relationship with a symbol (+ or -) near the origin of the arrow. Write the number of the receiver variable beside the sign. • Provide information about each relationship (line) on a tracking sheet or in an Excel file.
Procedure for drawing FCM (Cont’d) • 8. Use the tally sheets provided or an Excel file on a laptop to enter • the information needed • Top of page: Team number; page number • Using one row of the sheet for each line on the map: • Place a value in each box of the row • 1 “From” (driver) variable number • 2 “To” (recipient) variable number • 3 sign of the relationship (- or +) • 4 strength of association (1=weak; 5=strong) • 5 spatial extent, (1=very local; 5=pertains everywhere) • 6 temporal extent (1=rarely pertains; 5=always pertains) • 7 time to response (1=very slow; 5=immediate) • 8 scientific certainty (1=poor understanding; 5=certain) • 9 team’s confidence (1=very uncertain; 5=very confident) • 10 change feasibility (1= very difficult; 5=very easy) • 9. When the map is complete, tell a facilitator, who will photograph or scan your map.
“Arcs” (Arrows): Relationships between pairs of variables Attributes: Describe the strength of the relationship, (not the importance of the driver or the recipient) Sign: + = positive = negative Importance/strength 1 = unimportant 5 = very important Spatial extent 1 = rel. is local 5 = relationship holds everywhere Temporal extent 1= rel. rarely occurs 5 = relationship always holds Time to response 1=very long lag time 5= immediate response Scientific certainty 1=basis for rel. poorly 5 = strong scientific understood understanding Team’s confidence 1=little confidence in 5 = very confident in rating scoring Change_feasibility 1 = uncontrollable 5 = very controllable
Facilitators: Jan Ciborowski, Jesse Gardner Costa, Patrick Galvano (Windsor) Brad Bass, Igor Yeremin, Shreya Ghose (Envir Cda)