Download
1 / 1
10 likes | 91 Views
Project Title. John Smith Computer Science University of New Hampshire. Jeanne Bertrand Biology University of New Hampshire. Joanelle Davis Mathematics Elizabeth City State University. Dr. Sophie Aubrey Department of Computer Science University of New Hampshire. Mentors.

E N D
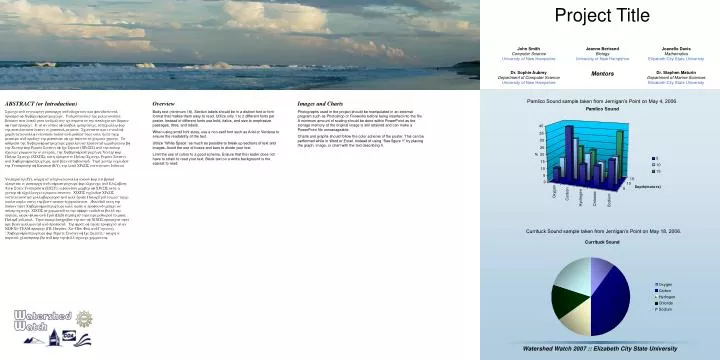
Project Title John Smith Computer Science University of New Hampshire Jeanne Bertrand Biology University of New Hampshire Joanelle Davis Mathematics Elizabeth City State University Dr. Sophie Aubrey Department of Computer Science University of New Hampshire Mentors Dr. Stephen Maturin Department of Marine Sciences Elizabeth City State University Pamlico Sound sample taken from Jernigan’s Point on May 4, 2006. Overview Body text (minimum 18). Section labels should be in a distinct font or font format that makes them easy to read. Utilize only 1 to 2 different fonts per poster. Instead of different fonts use bold, italics, and size to emphasize passages, titles, and labels. When using small font sizes, use a non-serif font such as Arial or Verdana to ensure the readability of the text. Utilize “White Space” as much as possible to break up sections of text and images. Avoid the use of boxes and bars to divide your text. Limit the use of colors to a good scheme. Ensure that the reader does not have to strain to read your text. Black text on a white background is the easiest to read. Images and Charts Photographs used in the project should be manipulated in an external program such as Photoshop or Fireworks before being inserted into the file. A minimum amount of scaling should be done within PowerPoint as the storage memory of the original image is still retained and can make a PowerPoint file unmanageable. Charts and graphs should follow the color scheme of the poster. This can be performed while in Word or Excel. Instead of using “See figure 1” try placing the graph, image, or chart with the text describing it. ABSTRACT (or Introduction) Science and engineering research and education are foundational drivers of Cyberinfrastructure. Understanding the relationship between sea level rise and melting ice sheets is the application domain of this project. It is an issue of global importance, especially for the populations living in coastal regions. Scientists are in need of computationally intensive tools and models that will help them measure and predict the response of ice sheets to climate change. To address the Cyberinfrastructure challenges presented immediately by the Center for Remote Sensing of Ice Sheets (CReSIS) and the polar science community in general, the Cyberinfrastructure Center for Polar Science (CICPS), with experts in Polar Science, Remote Sensing and Cyberinfrastructure, has been established. This center includes the University of Kansas (KU), the lead CReSIS institution; Indiana University (IU), which is internationally known for its broad expertise in research and infrastructure for eScience; and Elizabeth City State University (ECSU), a founding member of CReSIS with a center of excellence in remote sensing. CICPS includes CReSIS institutions as collaborators and will drive PolarGrid to meet their goals while using the best-known technologies. ,Founded with the vision that Cyberinfrastructure will have a profound impact on polar science, CICPS is committed to the effort needed to build the portal, work-flow and Grid (Web) services that are required to make PolarGrid real. This paper describes the set of CICPS projects that are being implemented and proposed. The first of these projects is an NSF CI-TEAM project (PI: Hayden, Co-PIs: Fox and Gogineni), “Cyberinfrastructure for Remote Sensing of Ice Sheets,” which a virtual classroom by and for the full science community. Currituck Sound sample taken from Jernigan’s Point on May 18, 2006. Watershed Watch 2007 :: Elizabeth City State University