Download
1 / 23
240 likes | 371 Views
Spring School of Spectroscopic Data Analyses 8-12 April 2013 Astronomical Institute of the University of Wroclaw Wroclaw, Poland. Spectral lines analysis. Rotational velocity and velocity fields. Giovanni Catanzaro INAF - Osservatorio Astrofisico di Catania.

E N D
Spring School of Spectroscopic Data Analyses 8-12 April 2013 Astronomical Institute of the University of Wroclaw Wroclaw, Poland Spectral lines analysis Rotational velocity and velocity fields Giovanni Catanzaro INAF - Osservatorio Astrofisico di Catania
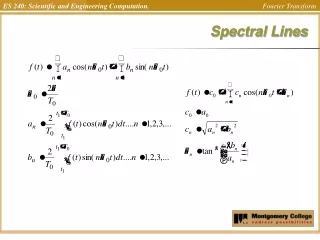
Projected rotational velocity Because the Doppler effectwe can seeonly the component of the equatorialvelocityparallel to the line of sight equator Spectroscopic School of Data Analyses
Special case: i=90º All rotational velocity is parallel to line of sight: star appears to rotate with veq equator Spectroscopic School of Data Analyses
Special case: i=0º All rotational velocity is perpendicular to line of sight: star appears not rotate equator Spectroscopic School of Data Analyses
Rotation shapes line profile Rotational profile Spectroscopic School of Data Analyses
Rotationalprofile limb darkening Spectroscopic School of Data Analyses
Profile fitting for v sin i Instrumental profile Observed spetrum with several synthetics overimposed. Each synthetic spectrum was computed for different value of rotational velocity. Spectroscopic School of Data Analyses
Importance of Resolution Teff = 7000 K Log g = 4.00 HERMES R = 80000 Example: FeII 5316.615 Å Spectroscopic School of Data Analyses
Fourier analysis ~0,007 Spectroscopic School of Data Analyses
Limb darkening Limb darkening shifts the zero to higher frequency Spectroscopic School of Data Analyses
The limb of the star is darker so these contribute less to the observed profile. You thus see more of regions of the star that have slower rotation rate. So the spectral line should looks like that of a more slowly rotating star, thus the first zero of the transform move to lower frequencies Spectroscopic School of Data Analyses
Velocity fields Motions of the photospheric gases introduce Doppler shifts that shape the profiles of most spectral lines Turbulence are non-thermal broadening • We can make two approximations: • The size of the turbulent elements is large compared to the unit optical depth Macroturbulent limit • The size of the turbulent elements is small compared to the unit optical depth Microturbulent limit Velocity fields are observed to exist in photospheres oh hot stars as well as cool stars. Spectroscopic School of Data Analyses
Macroturbulence Turbulent cells are large enough so that photons remain trapped in them from the time they are created until they escape from the star Lines are Doppler broadened: each cell produce a complete spectrum that is displaced by the Doppler shift corresponding to the velocity of the cell. The observed spectra is: In = In0 * Q(Dl) In0is the unbroadened profile and Q(Dl) is the macroturbulent velocity distribution. What do we use for Q? Spectroscopic School of Data Analyses
Radial-Tangent model We could just use a Gaussian (isotropic) distribution of radial components of the velocity field (up and down motion), but this is not realistic: Horizontal motion Convection zone Rising hot material Cool sinking material If you included only a distribution of up and down velocities, at the limb these would not alter the line profile since the motion would not be in the radial direction. The horizontal motion would contribute at the limb Radial motion → main contribution at disk center Tangential motion → main contribution at limb Spectroscopic School of Data Analyses
Assume that a certain fraction of the stellar surface, AT, has tangential motion, and the rest, AR, radial motion Q(Dl) = ARQR(Dl) + ATQT(Dl) The R-T prescription produces a different velocity distribution than an isotropic Gaussian. If you want to get more sophisticated you can include temperature differences between the radial and tangential flows. Spectroscopic School of Data Analyses
Effect of Macroturbulence It does not alter the total absorption of the spectral lines, lines broadened by macroturbulence are also made shallower. Macro 10 km/s 5 km/s 2.5 km/s 0 km/s Relative Intensity Pixel shift (1 pixel = 0.015 Å) Spectroscopic School of Data Analyses
There is a tradeoff between rotation and macroturbulent velocities. Youcancompensate a decrease in rotationbyincreasingthemacroturbulentvelocity. Atlow rotational velocities it is difficult to distinguish betweenthem: red line is computed for v sini = 3 km/s, x = 0 km/s blue line for v sini = 0 km/s and x = 3 km/s Relative Flux Amplitude Pixel (0.015 Å/pixel) Frequency (c/Å) While, In thewavelengthspacethedifferencesarebarelynoticeable, in Fourier space (right), thedifferencesare larger. Spectroscopic School of Data Analyses
Example: b Comae (Gray et al., 1996) d(s) individual lines h(s) thermal profile i(s) instrumental profile d(s) averaged and divided by i(s) Spectroscopic School of Data Analyses
Microturbulence Contrarly to macroturbulence, we deal with microturbulence when turbulent cells have sizes small compared to the mean free path of a photon. In this case the velocity distribution of the cells molds the line profile in the same way the particle distribution does. Particles velocity distribution (gaussian) The convolution of two gaussian is still a gaussian with a dispersion parameter given by: Line absorption coefficient without microturbulence Spectroscopic School of Data Analyses
Typical values for x are 1-2 km s-1 , small enough if compared to the other components of the line broadening mechanism. It is a very hard task to attempt the direct measurement of x by fitting the line profile. Very high resolution (>105), high SNR spectra and slow rotators stars (a few km s-1) are needed. Landstreet et al., 2009, A&A, 973 Spectroscopic School of Data Analyses
Blackwell diagrams 1998, A&A, 338, 1041 FeII CrII Spectroscopic School of Data Analyses
Other type of diagram: from a set of spectral lines, we require that the inferred abundance not depend on EW Example: HD27411, Teff = 7600 ± 150, log g = 4.0 ± 0.1 71 lines FeI Catanzaro & Balona, 2012, MNRAS, 421,1222 Spectroscopic School of Data Analyses
Thanks for your attention Spectroscopic School of Data Analyses