Download
1 / 41
410 likes | 541 Views
INTRODUCTION. Spice Excel. SPICE. Simulation Program with Integrated Circuit Emphasis. SPICE is a program which can be used to simulate analog electronic circuits. v_in. circuit. v_out.

E N D
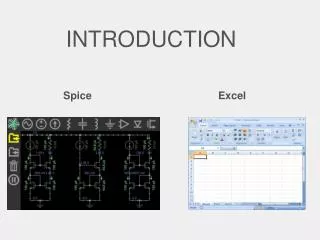
INTRODUCTION • Spice Excel
SPICE Simulation Program with Integrated Circuit Emphasis
SPICE is a program which can be used to simulate analog electronic circuits
v_in circuit v_out • Analog filter circuits have a parameter called a ‘Transfer Function’ which maps input to output with relation to frequency
Analog filter circuits have a parameter called a ‘Transfer Function’ which maps input to output with relation to frequency
Analog filter circuits have a parameter called a ‘Transfer Function’ which maps input to output with relation to frequency
Analog filter circuits have a parameter called a ‘Transfer Function’ which maps input to output with relation to frequency
Analog filter circuits have a parameter called a ‘Transfer Function’ which maps input to output with relation to frequency
Analog filter circuits have a parameter called a ‘Transfer Function’ which maps input to output with relation to frequency
A netlist is a text version of the circuit which describes the components and values for the computer to interpret and solve
A netlist is a text version of the circuit which describes the components and values for the computer to interpret and solve
A netlist is a text version of the circuit which describes the components and values for the computer to interpret and solve
A netlist is a text version of the circuit which describes the components and values for the computer to interpret and solve
A netlist is a text version of the circuit which describes the components and values for the computer to interpret and solve
A netlist is a text version of the circuit which describes the components and values for the computer to interpret and solve
* Basic DC circuit V1 1 0 20 R1 3 1 4k R2 3 2 10k V2 2 0 -10 R3 3 0 8k .OP .END • A netlist is a text version of the circuit which describes the components and values for the computer to interpret and solve
* Series_RLC Circuit V1 1 0 SIN(0 5 1k) AC 1 R1 2 1 50 L1 2 3 100mH C1 3 0 1uF .AC DEC 100 1 10k .END • A netlist is a text version of the circuit which describes the components and values for the computer to interpret and solve
WHAT IS SPICE? Spice is a software program that simulates electronic circuits and outputs the circuits’ basic characteristics such as: • Voltage • Current • Resistance at any location in the circuit HSpice is a version used in Unix PSpice is a version used in Windows T-Spice simpler tool meant for smaller circuits OptiSPICE is the best because it was written by your professor.
WORKFLOW • Create an Spice input file that describes the circuit • Run Spice • Inspect the output
THE NETLIST - A netlist describes the circuit to the program - Node 0 is always GROUND node name value R_R1 1 0 100 C_C1 1 2 0.01592u V_V1 2 0 dc 0.0 ac 1.0 sin(0.0 1.0 1.0 0 0)
THE INPUT FILE Title “my filter circuit” .options ingold=2 R_R1 1 0 100C_C1 1 2 0.01592u IC=0V_V1 2 0 dc 0.0 ac 1.0 sin(0.0 1.0 1.0 0 0) .print ac V(1) .ac LIN 100 0.001 1e+06 .op .END • The title must be the first line in the netlist (in order to recognize the options command) - R1 = 100Ω (Ohms) - C1 = 0.01592uF (micro Farads) with initial condition of 0 - V1 = sine wave with 1Hz frequency, 0 to 1V magnitude - Print ac voltage at node 1 - Want 100 frequency points from 0.001 to 1e+06
RUN T-SPICE • All Programs ->Tanner EDA -> T-Spice...
TRANSFER FUNCTION • Magnitude Plot - DB vs Hz (log scale) • Phase Plot - Degrees vs Hz Together these plots show the transfer function of the circuit at different frequencies For HSPICE and PSPICE use Excel to generate the plots
BIPOLAR JUNCTION TRANSISTOR • 3-terminals: Collector, Base, and Emitter • Common Emitter Amplifier • input = base with respect to the emitter • output = collector with respect to the emitter • Most commonly used configuration for transistor-based amplifiers as it produces the highest voltage, current, and power gain. Input Voltage Output Voltage
SOME USEFUL NETLIST STATEMENTS T : E+12 G : E+9 MEG : E+6 K : E+3 M : E-3 U: E-3 N: E-9 P: E-12 F: E-15 • Analysis Types: • Operating Point (.OC) - Voltage at each node and current from voltage sources • AC Analysis (.AC) - Small signal model output at different frequencies • Transient (.TRAN) - Circuit output as time passes • Scale factors:
SOME USEFUL NETLIST STATEMENTS • Components: Sweep Distributions: - DEC : Log distributions of points - LIN: Linear distribution of points
FORMAT CELLS • In the menu, choose Format Cells Scientific Notation: 0 decimals Number: 3 decimals
Excel can split text from one column into multiple columns using the command “Text to Columns”
$ • $ is used with cell coordinates, signifies leaving that coordinate constant • Example: rearrange v=d/tto give d=v*t The code
PASTE SPECIAL • Example: Make a row of data negative • Copy cell with -1 value, highlight cells that you want to become negative of the current values, Edit Paste Special Multiply • Other: transpose, add…
BEST FIT LINE • Right-click on a data point, choose Add Trendline using type: Linear, options: display equation on chart and R squared value.
STATISTICS • must have the Analysis Toolpak (go to Tools Add-ins, and install). • tools - data analysis - regression - x and y ranges - click residuals End


