Download
1 / 44
450 likes | 455 Views
Climate Change and Conservation. Eugene S. Takle Director, Climate Science Initiative Professor of Atmospheric Science Department of Geological and Atmospheric Sciences Professor of Agricultural Meteorology Department of Agronomy Iowa State University Ames, Iowa 50011 gstakle@iastate.edu.

E N D
Climate Change and Conservation Eugene S. Takle Director, Climate Science Initiative Professor of Atmospheric Science Department of Geological and Atmospheric Sciences Professor of Agricultural Meteorology Department of Agronomy Iowa State University Ames, Iowa 50011 gstakle@iastate.edu Iowa Water Conference Ames, Iowa 8-9 March 2010
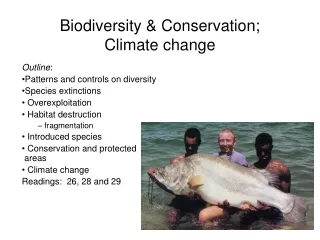
Outline • Causes of climate change • Global and regional changes in climate and projected future changes • Past trends in Iowa and producer adjustments to climate change • My speculation on future climate trends of importance to agriculture and conservation
NASA http://data.giss.nasa.gov/gistemp/graphs/
Global Mean Surface Temperature http://www.ncdc.noaa.gov/img/climate/research/2008/ann/global-jan-dec-error-bar-pg.gif
“One of the clearest trends in the United States observational record is an increasing frequency and intensity of heavy precipitation events… Over the last century there was a 50% increase in the frequency of days with precipitation over 101.6 mm (four inches) in the upper midwestern U.S.; this trend is statistically significant “ Karl, T. R., J. M. Melillo, and T. C. Peterson, (eds.), 2009: Global Climate Change Impacts in the United States. Cambridge University Press, 2009, 196pp.
Karl, T. R., J. M. Melillo, and T. C. Peterson, (eds.), 2009: Global Climate Change Impacts in the United States. Cambridge University Press, 2009.
Global Carbon Emissions (Gt) Actual emissions are exceeding worst case scenarios projected in 1990
Energy intensive Balanced fuel sources More environmentally friendly If current emission trends continue, global temperature rise will exceed worst case scenarios projected in 2007 Consider A1B FI =fossil intensive IPCC Fourth Assessment Report Summary for Policy Makers
Source: Jerry Meehl, National Center for Atmospheric Research
December-January-February Temperature Change 7.2oF 6.3oF A1B Emission Scenario 2080-2099 minus1980-1999
June-July-August Temperature Change 4.5oF A1B Emission Scenario 2080-2099 minus1980-1999 5.4oF
June-July-August Temperature Change 4.5oF A1B Emission Scenario 2080-2099 minus1980-1999 5.4oF Not the direction of current trends
Low confidence in model projection of summer precipitation IPCC 2007
Karl, T. R., J. M. Melillo, and T. C. Peterson, (eds.), 2009: Global Climate Change Impacts in the United States. Cambridge University Press, 2009, 196pp.
Karl, T. R., J. M. Melillo, and T. C. Peterson, (eds.), 2009: Global Climate Change Impacts in the United States. Cambridge University Press, 2009, 196pp.
Low confidence Karl, T. R., J. M. Melillo, and T. C. Peterson, (eds.), 2009: Global Climate Change Impacts in the United States. Cambridge University Press, 2009, 196pp.
Trend of increase in occurrence of heavy precipitation over the 20th C is consistent with increasing GHG concentrations. Frequency of intense precipitation events is likely to increase in the future. Karl, T. R., J. M. Melillo, and T. C. Peterson, (eds.), 2009: Global Climate Change Impacts in the United States. Cambridge University Press, 2009, 196pp.
The planet is committed to a warming over the next 50 years regardless of political decisions Adaptation Necessary Adaptation Necessary Mitigation Possible Karl, T. R., J. M. Melillo, and T. C. Peterson, (eds.), 2009: Global Climate Change Impacts in the United States. Cambridge University Press, 2009, 196pp.
The planet is committed to a warming over the next 50 years regardless of political decisions Adaptation Necessary Adaptation Necessary Mitigation Possible Karl, T. R., J. M. Melillo, and T. C. Peterson, (eds.), 2009: Global Climate Change Impacts in the United States. Cambridge University Press, 2009, 196pp.
Observed Summer (JJA) Daily Maximum Temperature Changes (K), 1976-2000 Adapted from Folland et al. [2001]
Observed Summer (JJA) Daily Maximum Temperature Changes (K), 1976-2000 Adapted from Folland et al. [2001]
Des Moines Airport Data 1983: 13 1988: 10 2009: 0
Des Moines Airport Data 1983: 13 1988: 10 6 days ≥ 100oF in the last 20 years 2009: 0
“Warming Hole”: Simulations of changes in daily maximum summertime temperatures between 1990s and 2040s DTmax (JJA) ˚C • Pan, Z., R. W. Arritt, E. S. Takle, W. J. Gutowski, Jr., C. J. Anderson, and M. Segal,2004: Altered hydrologic feedback in a warming climate introduces a “warming hole”. Geophys. Res. Lett.31, L17109, doi:10.1029/2004GL020528.
State-Wide Average Data Totals above 40”
Relationship of Streamflow to Precipitation in Current and Future Climates
Projected Changes* for the Climate of the Midwest Temperature • Longer frost-free period (high) • Higher average winter temperatures (high) • Fewer extreme cold temperatures in winter (high) • Fewer extreme high temperatures in summer in short term but more in long term (medium) • Higher nighttime temperatures both summer and winter (high) • More freeze-thaw cycles (high) • Increased temperature variability (high) Follows trend of last 25 years and projected by models No current trend but model suggestion or current trend but model inconclusive *Estimated from IPCC reports
Projected Changes* for the Climate of the Midwest Precipitation • More (~10%) precipitation annually (medium) • Change in “seasonality”: Most of the increase will come in the first half of the year (wetter springs, drier summers) (high) • More water-logging of soils (medium) • More variability of summer precipitation (high) • More intense rain events and hence more runoff (high) • Higher episodic streamflow (medium) • Longer periods without rain (medium) • Higher absolute humidity (high) • Stronger storm systems (medium) • More winter soil moisture recharge (medium) • Snowfall increases (late winter) in short term but decreases in the long run (medium) Follows trend of last 25 years and projected by models No current trend but model suggestion or current trend but model inconclusive *Estimated from IPCC reports
Projected Changes* for the Climate of the Midwest Other • Reduced wind speeds (high) • Reduced solar radiation (medium) • Increased tropospheric ozone (high) • Accelerated loss of soil carbon (high) • Phenological stages are shortened (high) • Weeds grow more rapidly under elevated atmospheric CO2 (high) • Weeds migrate northward and are less sensitive to herbicides (high) • Plants have increased water used efficiency (high) Follows trend of last 25 years and projected by models No current trend but model suggestion or current trend but model inconclusive *Estimated from IPCC and CCSP reports
Iowa Agricultural Producers’ Adaptations to Climate Change • Longer growing season: plant earlier, plant longer season hybrids, harvest later • Wetter springs: larger machinery enables planting in smaller weather windows • More summer precipitation: higher planting densities for higher yields • Wetter springs and summers: more subsurface drainage tile is being installed, closer spacing, sloped surfaces • Fewer extreme heat events: higher planting densities, fewer pollination failures • Higher humidity: more spraying for pathogens favored by moist conditions, more problems with fall crop dry-down, wider bean heads for faster harvest due to shorter harvest period during the daytime.
Will These Agriculturally Favorable Midwest Climate Trends Continue? Caution: These are my speculations!! • In the short-term (next 5-10 years) climatic conditions will be dominated by natural variability from base conditions of the past 20 years (not long-term averages) • If we continue to have high spring and summer rainfall and soil moisture, we likely will continue to have lower chances of extended periods of extreme heat • If we continue to have high spring and summer rainfall and soil moisture, we likely will continue to have pathogens favored by high humidities • In the longer term (>50 years), hot summers, milder winters, and higher variability of precipitation will become more dominant • Failure to limit global carbon emissions will accelerate trends toward less favorable agricultural climate for Iowa
Summary • There is no scientifically defensible explanation for atmospheric warming, increase in ocean heat content, and loss of ocean and land ice over the last 40 year other than increase of anthropogenic greenhouse gases • Some recent climate trends in the Midwest that have been favorable to agriculture likely will continue in the next few years • Climate challenges to agriculture and conservation interests will intensify toward mid-century • Global and regional climate models have much to offer for understanding future Midwest agriculture-climate and conservation-climate interactions • Agriculturists and conservationists needs future climate information at regional scales.
For More Information • North American Regional Climate Change Assessment Program: http://www.narccap.ucar.edu/ • For current activities on the ISU campus, regionally and nationally relating to climate change see the Climate Science Initiative website: http://climate.agron.iastate.edu/ • Contact me directly: gstakle@iastate.edu