Download
1 / 1
10 likes | 135 Views
Critical Environmental Areas in California. NSF Grant # DUE0653291. Jessica Aloisio City College Environmental Science sqirt584@gmail.com Natalia Alvarez City College Mechanical Engineering alvareznatalia1@yahoo.com. Introduction. Method. Results.

E N D
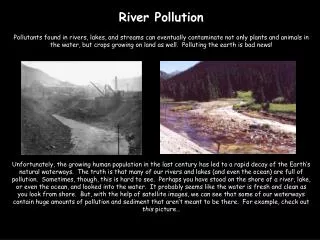
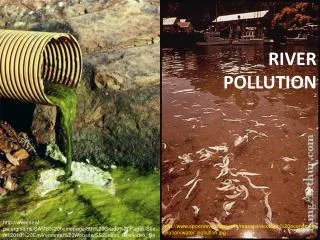
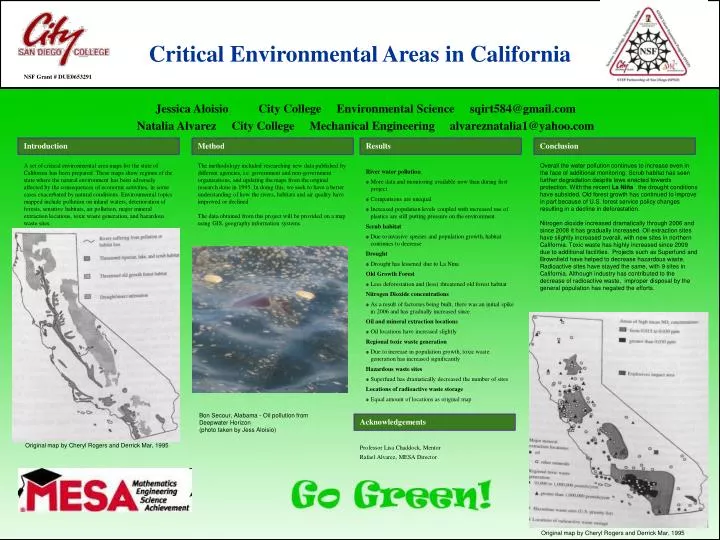
Critical Environmental Areas in California NSF Grant # DUE0653291 Jessica Aloisio City College Environmental Science sqirt584@gmail.com Natalia Alvarez City College Mechanical Engineering alvareznatalia1@yahoo.com Introduction Method Results Conclusion A set of critical environmental area maps for the state of California has been prepared. These maps show regions of the state where the natural environment has been adversely affected by the consequences of economic activities, in some cases exacerbated by natural conditions. Environmental topics mapped include pollution on inland waters, deterioration of forests, sensitive habitats, air pollution, major mineral extraction locations, toxic waste generation, and hazardous waste sites. The methodology included researching new data published by different agencies, i.e. government and non-government organizations, and updating the maps from the original research done in 1995. In doing this, we seek to have a better understanding of how the rivers, habitats and air quality have improved or declined. The data obtained from this project will be provided on a map using GIS, geography information systems. Overall the water pollution continues to increase even in the face of additional monitoring. Scrub habitat has seen further degradation despite laws enacted towards protection. With the recent La Niña the drought conditions have subsided. Old forest growth has continued to improve in part because of U.S. forest service policy changes resulting in a decline in deforestation. Nitrogen dioxide increased dramatically through 2006 and since 2008 it has gradually increased. Oil extraction sites have slightly increased overall, with new sites in northern California. Toxic waste has highly increased since 2009 due to additional facilities. Projects such as Superfund and Brownfield have helped to decrease hazardous waste. Radioactive sites have stayed the same, with 9 sites in California. Although industry has contributed to the decrease of radioactive waste, improper disposal by the general population has negated the efforts. River water pollution • More data and monitoring available now than during first project • Comparisons are unequal • Increased population levels coupled with increased use of plastics are still putting pressure on the environment Scrub habitat • Due to invasive species and population growth, habitat continues to decrease Drought • Drought has lessened due to La Nina Old Growth Forest • Less deforestation and (less) threatened old forest habitat Nitrogen Dioxide concentrations • As a result of factories being built, there was an initial spike in 2006 and has gradually increased since. Oil and mineral extraction locations • Oil locations have increased slightly Regional toxic waste generation • Due to increase in population growth, toxic waste generation has increased significantly Hazardous waste sites • Superfund has dramatically decreased the number of sites Locations of radioactive waste storage • Equal amount of locations as original map Bon Secour, Alabama - Oil pollution from Deepwater Horizon (photo taken by Jess Aloisio) Acknowledgements Original map by Cheryl Rogers and Derrick Mar, 1995 Professor Lisa Chaddock, Mentor Rafael Alvarez, MESA Director Original map by Cheryl Rogers and Derrick Mar, 1995