Download
1 / 13
130 likes | 157 Views
Learn about variables, scatterplots, correlation, and more. Explore the relationship between two quantitative variables using practical examples and in-depth explanations.

E N D
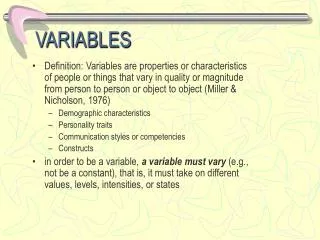
Variables • Dependent variable: measures an outcome of a study • Independent variable: explains or causes changes in the response variables
Bivariate Data • We often make two observations on each subject. We call such data bivariate data. Examples: • beliefs on abortion, political preference • height of a person, weight • dosage of drug, subject’s response • SAT score, first year college GPA
Case 1: Both variables qualitative • Cross tabulation table • Rows represent categories of 1st variable • Columns represent categories of 2nd variable • Count the number of observations falling into each combination of categories
Case 2: One qualitative variable, one quantitative variable • Side by side presentation of dot plots, box plots, 5 number summaries • How do the results differ?
Case 3: Two quantitative variables • Plot observed data on a graph • Horizontal (X) axis, one variable • Vertical (Y) axis, other variable
Scatterplots • A scatterplot shows the relationship between two quantitative variables measured on the same individuals. • If applicable, • Independent variable placed on horizontal axis (So, usually labeled as X) • Dependent variable place on vertical axis (So, usually labeled as Y)
Examining a Scatterplot • Form • Linear relationships, where the points show a straight-line pattern • Curved relationships • Clusters • Direction • Positive association • Negative Association • Strength • Determined by how close points in the scatterplot lie to a simple form such as a line
Examining a Scatterplot • In any graph of data, look for the overall pattern and for deviations from that pattern. • Two variables are positively associated when above-average values of one tend to accompany above-average values of the other and below-average values also tend to occur together • Two variables are negatively associated when above-average values of one accompany below-average values of the other and vice-versa
Correlation • Measures the direction and strength of the linear relationship between 2 quantitative variables. • Positive r suggests large values of X and Y occur together and that small values of X and Y occur together • Negative r suggests large values of one variable tend to occur with small values of the other variable
r = 1; all data on straight line with positive slope • r = -1; all data on straight line with negative slope • r = 0; no linear relationship • The stronger the linear relationship, the larger |r| • Existence of correlation does not imply cause/effect
Correlation: Need to Know(s) • No distinction between independent and dependent variable • Both variables must be quantitative • Correlation uses standardized values, so it does not change when we change the unit of measurement • Measures only the linear relationship • Correlation is strongly affected by a few outlying observations, so it should be used with caution when outliers appear in scatterplots
Applet Exploration • Go to the website • www.whfreeman.com/ips • Register as a student • Make sure to enter instructor’s email • kdbrad2@uky.edu