Download
1 / 21
500 likes | 2.36k Views
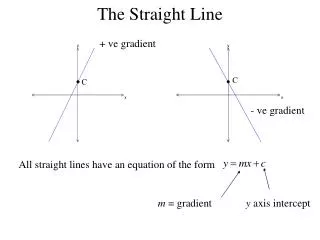
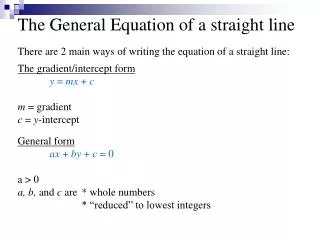
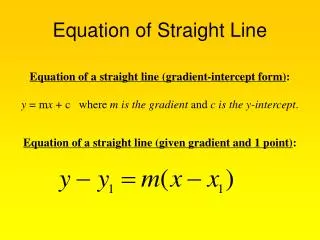
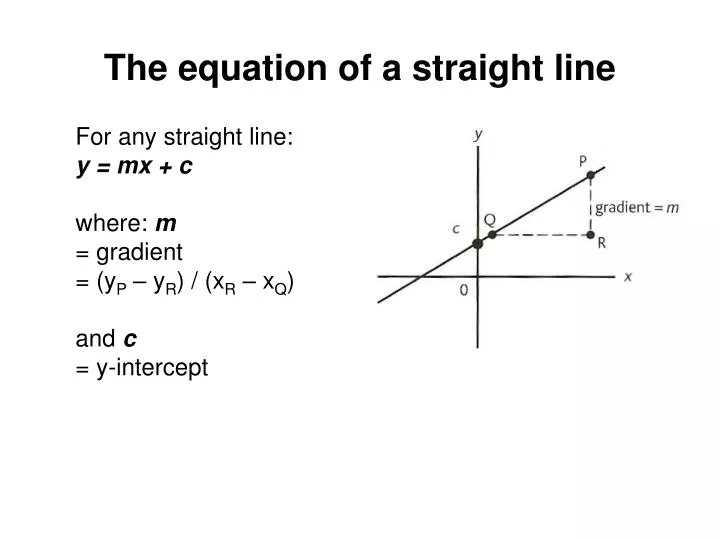
The equation of a straight line. For any straight line: y = mx + c where: m = gradient = (y P – y R ) / (x R – x Q ) and c = y-intercept. y. gradient = k. x n. The power law relationship. This has the general form: y = k x n where k and n are constants.

E N D
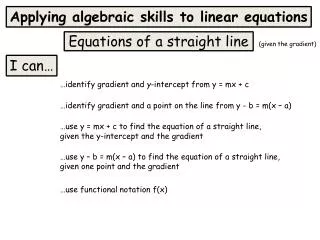
The equation of a straight line For any straight line: y = mx + c where: m = gradient = (yP – yR) / (xR – xQ) and c = y-intercept
y gradient = k x n The power law relationship This has the general form: y = k x n where k and n are constants. An example is the distance, s travelled after time, t when an object is undergoing acceleration, a. s = ½ at 2 s = y; t = x; 2 = n; ½ a = k To prove this relationship: • Draw a graph of y against x n • The graph should be a straight line through the origin and have a gradient equal to k
Common examples power, n = 1: direct proportion relationship: y = k x – prove by plotting y against x power, n = 2: square relationship: y = k x2 – plot y against x2 power, n = 3: cube relationship: y = k x3 – plot y against x3 power, n = ½: square root relationship: y = k x ½= k √x – plot y against x ½ power, n = - 1: inverse proportion relationship: y = k x -1= k / x – plot y against 1 / x power, n = - 2: inverse square relationship: y = k x -2= k / x2 – plot y against 1 / x2 In all these cases the graphs should be straight lines through the origin having gradients equal to k.
Question Quantity P is thought to be related to quantities Q, R and T by the following equation: P = 2π Q R 2 T 3 What graphs should be plotted to confirm the relationships between P and the other quantities? State in each case the value of the gradient.
When n is unknown EITHER - Trial and error Find out what graph yields a straight line. This could take a long time! OR - Plot a log (y) against log (x) graph. Gradient = n y-intercept = log (k)
Consider: 10 = 10 1 100 = 10 2 1000 = 10 3 5 = 10 0.699 50 = 10 1.699 500 = 10 2.699 2 = 10 0.301 20 = 10 1.301 200 = 10 2.301 In all cases above the power of 10 is said to be the LOGARITHM of the left hand number to the BASE OF 10 For example: log10(100) = 2 log10(50) = 1.699 etc.. (on a calculator use the ‘lg’ button) Logarithms
Logarithms can have any base number but in practice the only other number used is 2.718281…, Napier’s constant ‘e’. Examples: loge(100) = 4.605 loge(50) = 3.912 etc.. (on a calculator use the ‘ln’ button) These are called ‘natural logarithms’ Natural Logarithms
log (A x B) = log (A) + log (B) Example consider: 20 x 50 = 1000 this can be written in terms of powers of 10: 10 1.301 x 10 1.699 = 10 3 Note how the powers (the logs to the base 10) relate to each other: 1.301 + 1.699 = 3.000 Multiplication with logarithms
log (A ÷ B) = log (A) - log (B) Consider: 100 ÷ 20 = 5 this can be written in terms of powers of 10: 10 2÷ 10 1.301 = 10 0.699 Note how the powers relate to each other: 2 - 1.301 = 0.699 Division with logarithms
log (An) = n log (A) Consider: 2 3 = 2 x 2 x 2 this can be written in terms of logs to base 10: log10 (2 3) = log10 (2) + log10 (2) + log10 (2) log10 (2 3) = 3 x log10 (2) Powers with logarithms
log B(Bn) = n Example: log10 (10 3) = log10 (1000) = 3 The most important example of this is: ln (en) = n [ loge (en) = n ] Another logarithm relationship
How log-log graphs work The power relationship has the general form: y = k x n where k and n are constants. Taking logs on both sides: log (y) = log (k x n) log (y) = log (k) + log (x n) log (y) = log (k) + n log (x) which is the same as: log (y) = n log (x) + log (k)
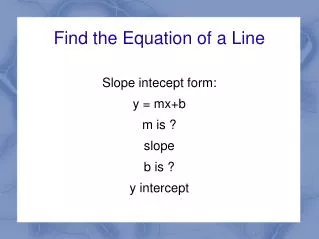
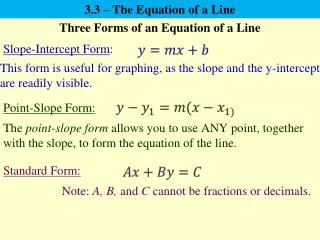
log (y) = n log (x) + log (k) This has the form of the equation of a straight line: y = m x + c where: y = log (y) x = log (x) m = the gradient = the power n c = the y-intercept = log (k)
Question Dependent variable P was measured for various values of independent variable Q. They are suspected to be related through a power law equation: P = k Q n where k and n are constants. Use the measurements below to plot a log-log graph and from this graph find the values of k and n.
Exponential decay This is how decay occurs in nature. Examples include radioactive decay and the loss of electric charge on a capacitor. The graph opposite shows how the mass of a radioactive isotope falls over time.
Exponential decay over time has the general form: x = xo e - λ t where: t is the time from some initial starting point xis the value of the decaying variable at time t xo is the initial value of x when t = 0 e is Napier’s constant 2.718… λ is called the decay constant. • It is equal to the fraction of x that decays in a unit time. • The higher this constant the faster the decay proceeds.
In the radioisotope example: t = the time in minutes. x= the mass in grams of the isotope remaining at this time xo = 100 grams (the starting mass) e = Napier’s constant 2.718… λ = the decay constant is equal to the fraction of the isotope that decays over each unit time period (1 minute in this case). About 0.11 min-1 in this example.
Proving exponential decay graphically x = xo e - λ t To prove this plot a graph of ln (x) against t . If true the graph will be a straight line and have a negative gradient. Gradient = - λ y-intercept = ln (xo) NOTE: ONLY LOGARITMS TO THE BASE e CAN BE USED.
How ln-t graphs work Exponential decay has the general form: x = xo e - λ t Taking logs TO THE BASE e on both sides: ln (x) = ln (xo e - λ t) ln (x) = ln (xo ) + ln (e - λ t) ln (x) = ln (xo ) - λ t which is the same as: ln (x) = - λ t + ln (xo )
ln (x) = - λ t + ln (xo ) This has the form of the equation of a straight line: y = m x + c with: y = ln (x) x = t m, the gradient = the negative of the decay constant = - λ c, the y-intercept = ln (xo )
Question The marks M of a student are suspected to decay exponentially with time t. They are suspected to be related through the equation: M = Mo e – k t. Use the data below to plot a graph of ln(M) against t and so verify the above statement. Also determine the student’s initial mark Mo (t = 0 weeks) and the decay constant k, of the marks.