Download
1 / 31
310 likes | 388 Views
GxDb a universal tool to collect, analyse , manage and visualize transcriptomic data. Wolfgang Raffelsberger, Raymond Ripp and Laetitia Poidevin. BingGi Days January 2010. Introduction. What is transcriptomic ?

E N D
GxDb a universal tool to collect, analyse, manage and visualize transcriptomic data Wolfgang Raffelsberger, Raymond Ripp and Laetitia Poidevin BingGi Days January 2010
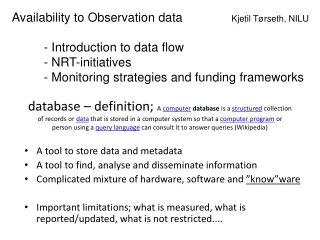
Introduction • What is transcriptomic ? • -> a high throughput analysis of gene expression by measuring the amount of mRNA • What are the techniques ? • -> DNA microarrays • -> SAGE • -> Differential Display • -> …. • => large quantities of data • GxDb: integrative tool to collect treat analyze manage visualize
Organization of data in GxDb Arraytype ex: Mouse430_2 Sample ex: mouse wt aged 9 day Organism • Individual • name • age • description SampleCondition Genotype Tissue Treatment
Organization of data in GxDb RealExp RealExp 2 Arraytype Arraytype ex: Mouse430_2 RealExp 3 Arraytype Sample ex: wt_d9 Arraytype RealExp 4 ex: wt_d9 Sample 2 CEL file r1 Arraytype ex: wt_d11 Sample 3 CEL file r2 CEL file r3 ex: wt_d13 CEL file r3 Sample 4 CEL file r4 CEL file r6 ex: wt_d15 CEL file r5 CEL file r7 CEL file r8 CEL file r9 CEL file r10 CEL file r11
Organization of data in GxDb RealExp 2 RealExp 2 Experiment Experiment Arraytype Arraytype RealExp RealExp Sample 2 Sample 2 Signal Intensity Ratio Cluster ≠ expressed genes Quality Arraytype Arraytype Arraytype Arraytype RealExp 3 RealExp 3 CEL file r3 CEL file r3 Sample Sample Arraytype Arraytype CEL file r4 CEL file r4 RealExp 4 RealExp 4 CEL file r5 CEL file r5 Treatment and Analysis protocol Treatment and Analysis protocol Sample 3 Sample 3 CEL file r1 CEL file r1 Arraytype Arraytype CEL file r2 CEL file r2 CEL file r3 CEL file r3 Sample 4 Sample 4 CEL file r6 CEL file r6 CEL file r7 CEL file r7 CEL file r8 CEL file r8 CEL file r9 CEL file r9 CEL file r10 CEL file r10 CEL file r11 CEL file r11
Treatment and Analysis protocol 1) Normalization 6 methods: RMA, gcRMA, dChip, MAS5.0, plier, vsn => signal intensity 2) Calculate average (between replicats) and ratio 3) Filtering - Eliminate probesets that are never expressed in all arrays of one experiment based on distribution or call (according to normalization method) - Eliminate probesets with very low changes between condition et reference based on fold change based on standard deviation 4) Statistical analysis - method: t-test combined with empirical bayes for shrinkage -estimation of FDR (false discovery rate) - tag probesets with differential expression (automatic threshold findings)
Treatment and Analysis protocol 1) Normalization 2) Calculate average (replicats) and ratio 3) Filtering 4) Statistical analysis 5) Clustering tool: Cluspack methods: k-means (DPC) Mixtures models (aic and bic) => clusters 6) Quality Control Report tool: RReportGenerator for Automatic Statistical Analysis Automatic Statistical Analysis to estimate the quality of arrays
Upload form Step 1: Selection of Arraytype and Experiment
Upload form Step 1 Create your new experiment
Upload form Step 1 Create your news samples Organism Genotype SampleCondition Individual TreatmentType Treatment Tissue Sample
Upload form Step 1: Selection of Arraytype and Experiment
Upload form Step 2: Upload of .cel files
Upload form Step 3: Select the corresponding sample to each cel file
Upload form Step 4: Select the interesting comparisons to calculate ratio Ratio: Condition / reference Example: C3H_rd1_d10 / C3H_wt_d10
Upload form Step 5: Launch Treatment and Analysis protocol
Upload form Step 5: Clustering, Quality analysis and loading in database
Organization of data in GxDb Arraytype-Probeset Signal Intensity Ratio ≠ expressed gene Clustering Cel file RealExp Experiment Sample Quality
Query GxDb Experiment Sample Probeset RealExp Signal Intensity Ratio Cluster
Visualization in GxDb time-course of retinal development
Star3 Star4 Star5 Star6 Star7 Star8 GxDbressources Languages used: PHP (HTML) - Upload - PipeWork - RadarGenerator - Fed R - Treatment and analysis protocol - RReportGenerator SQL Tcl - Gx (~ Gscope) - Probeset loading C - Cluspack /GxData GxDb SQL database alnitak http://gx.igbmc.fr Web Services Café des sciences QSub Ordonnanceur • GxDb Website • Upload • Querying • Display
Conclusion and Prospects • Automated raw-data upload, storage, treatment and analysis • multiple treatment protocols • multiple clustering methods • multiple human and automatic expert analysis • => Comparisons • => Analyse the strengths and weaknesses of the differentprotocols • Improvement of website • More user friendly • Visualization of clusters, ratio • Tools for meta-analysis • Possibility of upload data directly from GEO • Diagnostic report to analyze easier the data • Links to others databases and tools: STRING, GSEA..
Ratio Pipework Organism Normalization Ratio minimum Ratio maximum
Advantages of GxDb • Integration and storage in a unifying format • Automated raw-data upload, storage, treatment and analysis • multiple treatment protocols • multiple clustering methods • multiple human and automatic expert analysis • => Comparisons • => Analyse the strengths and weaknesses of the differentprotocols • Facilitated querying and data visualization
RealExp 3 RealExp 4 RealExp 2 Arraytype Arraytype Arraytype Arraytype Arraytype Arraytype Sample 3 Sample 2 Sample 4 CEL file r9 CEL file r6 CEL file r3 CEL file r4 CEL file r10 CEL file r7 CEL file r5 CEL file r11 CEL file r8 GxDb transcriptomics RealExp Arraytype Arraytype Sample CEL file r1 CEL file r2 CEL file r3
RealExp 3 RealExp 2 RealExp 4 Arraytype Arraytype Arraytype Arraytype Arraytype Arraytype Sample 4 Sample Sample CEL file r1 CEL file r9 CEL file r1 CEL file r2 CEL file r2 CEL file r10 CEL file r3 CEL file r3 CEL file r11 45000 • PROBESET 3 • probeset_id • genename • genedescription • species • speciessymbol • representpublicid • refseqtranscriptid • gscope_id • swissprot • unigene_id • entrezgene • ensembl • mgi • cytoband • chromoloc • omim • tissuespecificity • linkeddiseases • go_biologicalprocess • go_cellularcomponent • go_molecularfunction • pathway • interpro • transmembrane Experiment • PROBESET 2 • genename • probeset_id • genedescription • species • speciessymbol • representpublicid • refseqtranscriptid • gscope_id • swissprot • unigene_id • entrezgene • ensembl • mgi • cytoband • chromoloc • omim • tissuespecificity • linkeddiseases • go_biologicalprocess • go_cellularcomponent • go_molecularfunction • pathway • interpro • transmembrane Arraytype RealExp 1 • PROBESET • probeset_id • genename • genedescription • species • speciessymbol • representpublicid • refseqtranscriptid • gscope_id • swissprot • unigene_id • entrezgene • ensembl • mgi • cytoband • chromoloc • omim • tissuespecificity • linkeddiseases • go_biologicalprocess • go_cellularcomponent • go_molecularfunction • pathway • interpro • transmembrane Arraytype Arraytype Signal Intensity Ratio Cluster Sample CEL file r1 CEL file r2 CEL file r3 Sample • Individual • name • age • description Tissue SampleCondition Treatment Organism Genotype
GxDb protocol from upload to display Arraytypes Sample already exists ? already exists ? Create new Arraytype • Create new Sample with • existing or new Individual • existing or new Organism • existing or new Tissues • existing or new Genotype • existing or new Treatment • Upload your .CEL files • Enter their association to • Arraytypes and Samples • Define Couples of RealExps • for the Ratio Calculation • Fill in the other information • for the Experiment Differentially Expressed Genes Signal Intensity Quality Report Cluster Ratio Run Automatic Analysis Query and Display Results