Download
1 / 45
450 likes | 576 Views
Adults and children estimated to be living with HIV/AIDS as of end 2000. Eastern Europe & Central Asia 700 000. Western Europe 540 000. North America 920 000. East Asia & Pacific 640 000. North Africa & Middle East 400 000. South & South-East Asia 5.8 million. Caribbean

E N D
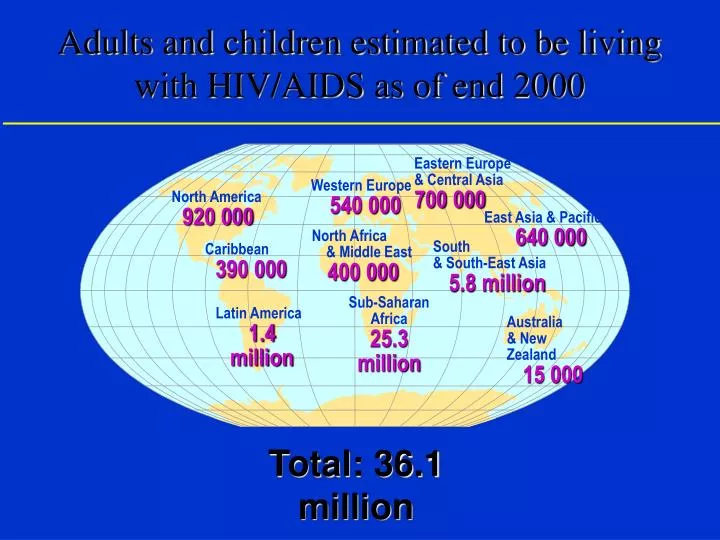
Adults and children estimated to be living with HIV/AIDS as of end 2000 Eastern Europe & Central Asia 700 000 Western Europe 540 000 North America 920 000 East Asia & Pacific 640 000 North Africa & Middle East 400 000 South & South-East Asia 5.8 million Caribbean 390 000 Sub-Saharan Africa 25.3 million Latin America 1.4 million Australia & New Zealand 15 000 Total: 36.1 million
A global view of HIV infection33 million adults living with HIV/AIDS as of end 1999
Spread of HIV over timein sub-Saharan Africa, 1984 to 1999 Estimated percentage of adults (15–49) infected with HIV 20.0% – 36.0% 10.0% – 20.0% 5.0% – 10.0% 1.0% – 5.0% 0.0% – 1.0% trend data unavailable outside region
Spread of HIV over time in Asia, 1984 to 1999 2.0% – 5.0% 1.0% – 2.0% 0.5% – 1.0% 0.1% – 0.5% 0.0% – 0.1% trend data unavailable outside region
About 15 000 new HIV infections a day in 1999 • More than 95% are in developing countries • 1 700 are in children under 15 years of age • About 13 000 are in persons aged 15 to 49 years, of whom: • almost 50% are women • about 50% are 15–24 year olds • More than 95% are in developing countries • 1 700 are in children under 15 years of age • About 13 000 are in persons aged 15 to 49 years, of whom: • almost 50% are women • about 50% are 15–24 year olds
4,000,000 3,500,000 3,000,000 Highly industrialized countries 2,500,000 North Africa & Middle East Eastern Europe & Central asia 2,000,000 Sub-Saharan Africa Latin America & the Caribbean 1,500,000 Southern & Eastern Asia 1,000,000 500,000 - 80 81 82 83 84 85 86 87 88 89 90 91 92 93 94 95 96 97 98 99 Estimated annual number of new HIV infections by region, 1980 to 1999 New infections
Where did HIV come from? Why did it occur as an epidemic? Why did it occur in the 1980’s?
TGATAA GTTACCA CGCTTA ATAGCCT HIV-1 subgenomic regions utilized for epidemiological linkage analysis. A schematic representation of the HIV-1 genome is shown, with brackets denoting the subgenomic gag, gp120, gp41, and LTR fragments that were amplified for diagnostic PCR analysis. Overlapping gag and gp120 regions are denoted by capital letters (gagA to -H; gp120A to -C) and are referred to in Tables 2 to 4. Stanley A. Trask,1 Cynthia A. Derdeyn,2 Ulgen Fideli,3 Yalu Chen,1 Sreelatha Meleth,1 Francis Kasolo,4 Rosemary Musonda,5 Eric Hunter,2 Feng Gao,1 Susan Allen,3 and Beatrice H. Hahn1,2* Journal of Virology, January 2002, p. 397-405, Vol. 76, No. 1
Molecular linkage analysis for a subset of putative HIV-1 transmission pairs. A phylogenetic tree was constructed from partial gp41 sequences Horizontal branch lengths are drawn to scale (the scale bar represents 0.05 nucleotide substitutions per site); vertical separation is for clarity only. Asterisks indicate bootstrap values in which the cluster to the right is supported in >80% replicates (out of 1,000). Newly derived sequences from 42 transmission pairs (84 individuals) are shown, along with 26 reference sequences from the Los Alamos Sequence Database (http://hiv-web.lanl.gov/HTML/alignments.html). Viruses from 36 couples are closely related to one another and cluster together with significant bootstrap values, indicating that they are epidemiologically linked (highlighted in red and denoted by dots). Viruses from six couples do not cluster together and exhibit a range of within-couple diversity that is similar to that of the reference sequences (highlighted in blue and denoted by triangles), indicating that they are epidemiologically unlinked. Two small brackets denote viral subclusters, each involving viruses from two sets of couples (see text for details). Brackets on the far right indicate major group M sequence subtypes. Journal of Virology, January 2002, p. 397-405, Vol. 76, No. 1
Within-group diversity among linked and unlinked Zambian transmission pairs and corresponding reference sequences. Subtype C reference sequences (n = 15) from the Los Alamos HIV/SIV Sequence Database (Table 1) were subjected to pairwise sequence comparisons in the region corresponding to the PCR-amplified gp41 fragment shown in Fig. 1. Pairwise sequence distances were also calculated for 66 subtype C transmission pairs classified as linked and 15 subtype C transmission pairs classified as unlinked in the same genomic region. The distribution of distance values for these three different groups is depicted as boxes, with the lower and upper limits of the box delineating the 25th and 75th percentiles and the bars indicating the 10th and 90th percentiles, respectively. The median distance of the linked viral group (median = 1.5) was significantly different from that of both the unlinked viral group (median distance = 8.8) and the reference sequence group (median distance = 8.2) (P < 0.0001, one-sided Mann-Whitney test [17]). In contrast, the median sequence distance of the unlinked viral group was not statistically different from that of the reference sequence group (P > 0.05, Mann-Whitney test). Stanley A. Trask,1 Cynthia A. Derdeyn,2 Ulgen Fideli,3 Yalu Chen,1 Sreelatha Meleth,1 Francis Kasolo,4 Rosemary Musonda,5 Eric Hunter,2 Feng Gao,1 Susan Allen,3 and Beatrice H. Hahn1,2* Journal of Virology, January 2002, p. 397-405, Vol. 76, No. 1
Transmission networks within the ZUHRP cohort. Phylogenetic trees were constructed from gp41 sequences of viruses infecting four different transmission pairs putatively classified as linked by pairwise sequence analysis. Couple identifiers are indicated in red (F, female partner; M, male partner). Horizontal branch lengths are drawn to scale (the scale bar represents 0.05 nucleotide substitutions per site); vertical separation is for clarity only. Values at nodes indicate the percentage of bootstraps in which the cluster to the right was found; only values of 80% are shown. Representative subtype C (left) and subtype G (right) reference sequences are included in each tree. Donor partners are underlined. Journal of Virology, January 2002, p. 397-405, Vol. 76, No. 1
Sequence of simian immunodeficiency virus from macaque and its relationship to other human and simian retroviruses. Chakrabarti L, Guyader M, Alizon M, Daniel MD, Desrosiers RC, Tiollais P, Sonigo P. Nature 1987 Aug 6-12;328(6130):543-7 • Isolation and partial characterization of an HIV-related virus occurring naturally in chimpanzees in Gabon.Peeters M, Honore C, Huet T, Bedjabaga L, Ossari S, Bussi P, Cooper RW, Delaporte E. AIDS. 1989 Oct;3(10):625-30. Genetic organization of a chimpanzee lentivirus related to HIV-1.Huet T, Cheynier R, Meyerhans A, Roelants G, Wain-Hobson S.Nature 1990 May 24;345(6273):
Origin of HIV-1 in Pan troglodytes troglodytes.a, Geographic ranges of the four subspecies of the common chimpanzee (Pan troglodytes) defined by mtDNA analysis (adapted from refs 19, 20 with permission). Nature397, 436 - 441 (1999)
c, Unrooted neighbour-joining tree of partial Pol protein sequences (distances are drawn to scale). Nature397, 436 - 441 (1999)
b, Phylogenetic tree of mtDNA sequences. Positions of sequences from the SIVcpz-infected chimpanzees Marilyn (SIVcpzUS), GAB1 (SIVcpzGAB1), GAB2 (SIVcpzGAB2) and Noah (SIVcpzANT) are boxed. Horizontal branch lengths are drawn to scale with the bar indicating 0.1 nucleotide replacements per site. Numbers at each node indicate the percentage of bootstrap samples (out of 1,000) in which the cluster to the right is supported (only values >80% are shown). Brackets on the right indicate previously defined subspecies/species classifications19, 20 (P. t. troglodytes , P. t. schweinfurthii, P.t.verus, and P. t. vellerosus are colour coded as in a). Nature397, 436 - 441 (1999)
c, Schematic tree of Pol sequences, highlighting the position of HIV-1 group M, N and O viruses in relation to P. t. troglodytes (red) and P. t. schweinfurthii (blue) viruses. The position of SIVcpzGAB2 (indicated by broken line), for which only partial sequence is available10, is inferred from the phylogeny shown in Fig. 1c. Nature397, 436 - 441 (1999)
Distribution of HIV-1 env genetic subtypes in different geographic locales from the DRC. JOURNAL OF VIROLOGY,Nov. 2000, p.10498–10507
Intra- and intersubtype genetic distances in the env V3-V5 region of HIV-1 isolates from the DRC. Range of lowest to highest distance within a subtype is in parentheses. A/E, CRF01-AE. JOURNAL OF VIROLOGY,Nov. 2000, p.10498–10507
Figure 1. Phylogenetic analysis of HIV-1 group M and SIVcpz from Pan troglodytes troglodytes in different gene regions. Trees also include HIV-1 group O as the outgroup. Branch lengths were estimated by assuming unequal evolutionary rates along them. Horizontal branch lengths are drawn to scale with the bar indicating 0.1 nucleotide replacements per site. Nodes with asterisks were supported by greater than 95% bootstrap samples (out of 1,000). The branch length to the outgroup is mentioned on the branch. The strains are described in Materials and Methods. A)pol region, nt 2358-3809; B) full-length envelope.
Table 1. Divergence times of the major nodes of the HIV-1/SIVcpz phylogenetic tree a The length of the branch was estimated using 1st + 3rd codon position clock-like evolving sites of pol. Standard errors are indicated. b The height of the branch was estimated using 656 out of 737 nucleotide clock-like evolving sites at 1st codon position of env. Standard errors are indicated. c 99% confidence intervals for the estimated year of origin are given in parenthesis.
Figure 1. Detection of HIV-1/HIV-2 cross-reactive antibodies in sera from 11 primate species by using a line immunoassay (INNO-LIA HIV Confirmation, Innogenetics, Ghent, Belgium). Varying patterns of reactivity to HIV peptides and proteins (HIV-1 gp120, gp41, p31, p24, and p17; HIV-2 gp130, and gp36) are shown. Samples from which Simian immunodeficiency virus (SIV) sequences were subsequently amplified by polymerase chain reaction are color-coded as in Figure 2. Plasma samples from HIV-1/HIV-2-negative and -positive persons are shown as controls on the left.The 3+, 1+ and +/- bands at the top of all test strips control for sample addition (presence of plasma immunoglobulin) and test performance (binding of secondary antibody). EID Volume 8, Number 5, May 2002 Risk to Human Health from a Plethora of Simian Immunodeficiency Viruses in Primate Bushmeat Martine Peeters,* Valerie Courgnaud,* Bernadette Abela,† Philippe Auzel,†‡ Xavier Pourrut,* Frederic Bibollet-Ruche,§ Severin Loul,† Florian Liegeois,* Cristelle Butel,* Denis Koulagna,¶ Eitel Mpoudi-Ngole,† George M. Shaw,§ Beatrice H. Hahn,§ and Eric Delaporte**
EID Volume 8, Number 5, May 2002 Risk to Human Health from a Plethora of Simian Immunodeficiency Viruses in Primate Bushmeat Martine Peeters,* et al Figure 2. Identification of diverse Simian immunodeficiency virus (SIV) lineages in primate bushmeat. A 650-bp pol fragment was amplified from monkeys representing seven primate species, sequenced, and subjected to phylogenetic tree analysis. The positions of 21 SIV sequences from the present study (in color) are shown in relation to HIV/SIV reference sequences from the Los Alamos HIV/SIV Sequence Database (in black). The consensus length of the final alignment used for tree construction was 555 bp. The new species-specific SIV lineages are generally identified by a lower-case three-letter code corresponding to the initial letters of the common species name (e.g., SIVgsn for greater spot-nosed monkeys [Cercopithecus nictitans], SIVmus for mustached guenons [C. cephus] and SIVmon for mona monkeys [C. mona]). Lineages are defined as clusters of viral sequences from the same primate species that group together with significant (>80%) bootstrap values. We maintained the lineage designation of SIVtal previously assigned to a virus thought to be derived from a zoo animal of the species Miopithecus talapoin (28) since that sequence, and the two newly derived talapoin viruses from M. ogouensis, cluster together in a phylogenetic tree derived from additional pol nucleotide sequences (not shown). Branch lengths are drawn to scale (the bar indicates 10% divergence).
Lentiviruses, primates, HIV-1 and HIV-2 and Polio Vaccine • Related lentiviruses have been found infecting numerous species of primates in sub-Saharan Africa. The only species naturally infected with viruses closely related to HIV-2 is the sooty mangabey (Cercocebus atys) from western Africa, • Similarly, the only viruses very closely related to HIV-1 have been isolated from chimpanzees (Pan troglodytes), and in particular those from western equatorial Africa, • HIV-1 and HIV-2 have each arisen several times: in the case of HIV-1, the three groups (M, N and O) are the result of independent cross-species transmission events. • Consistent with the phylogenetic position of a 'fossil' virus from 1959, molecular clock analyses using realistic models of HIV-1 sequence evolution place the last common ancestor of the M group prior to 1940 • Both the inferred geographical origin of HIV-1 and the timing of the cross-species transmission are inconsistent with the suggestion that oral polio vaccines could be responsible for the origin of acquired immune deficiency syndrome. The origins of acquired immune deficiency syndrome viruses: where and when?Author(s): Paul M. Sharp ; Elizabeth Bailes ; Roy R. Chaudhuri ; Cynthia M. Rodenburg ; Mario O. Santiago ; Beatrice H. Hahn Source: Philosophical Transactions: Biological Sciences Volume: 356 Number: 1410 Page: 867 -- 876
Population Growth outstripping available resources
Population Growth and % Total Population of Selected African Cities 1920 to 2000