Download
1 / 34
340 likes | 344 Views
This paper analyzes various methods for reconstructing historical temperatures during the last millennium and discusses their significance in detecting anthropogenic climate change. The results indicate that preindustrial temperature variations may be larger than previously shown, and the debate surrounding this topic has been unfortunate. The paper also emphasizes the importance of reproducible methodology, independent peer review, and data accessibility in climate research.

E N D
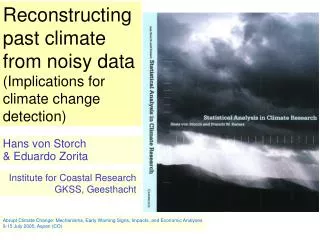
Reconstruction of historical temperatures during the last millennium- analysis of methods- significance for detection of anthropogenic climate change Hans von Storch & Eduardo Zorita Institute for Coastal Research GKSS Research Center, Germany Fidel González-Rouco, Universidad Complutense,Madrid, Spain Meeting #1 Open Session of Committee on Surface Temperature Reconstructions for the past 1,000-2,000 Years: Synthesis of Current Understanding and Challenges for the Future, Washington, 2.3.2006
Our results indicate … The temperature variations during the preindustrial times (1000-1850) are likely considerably larger than shown by the “shaft” of the “hockeystick”. The significance of the “blade” for detecting ongoing anthropogenic climate change is not compromised by the choice of the various historical reconstructions.
The debate has been unfortunate as … • Premature declaration of validity of a knowledge claim; • Critique stifled instead of encouraging debate and discussion to get a full airy for concern of misuse in the political process; IPCC chairmann Pachauri in “nature”, 2005
Peer review process: no publication without reproducible description of complex methodology; IPCC and related processes: Have independent scientists doing the review; not the key authors in the field. Data access: Relevant data and details of algorithms need to be made public even to “adversaries”. Major conclusions should be "We have 25 or so years invested in the work. Why should I make the data available to you, when your aim is to try and find something wrong with it." (Jones' reply to Warwick Hughes, 21. Februar 2005; confirmed by P. Jones)
Our work • Are the methods suggested by MBH98 and by Moberg 2005 reliable in returning unbiased estimates of low-frequency temperature variations? • How good is the method of inverting terrestrial borehole temperature profiles? • This is tested in the laboratory of a 1000 year simulation exposed to estimated natural and anthropogenic forcings.
Relevant new publications from our international and interdisciplinary group • Zorita, E., and H. von Storch, 2005: Methodical aspects of reconstructing non-local historical temperatures, Memorie della Società Astronomica Italia 76, p.794ff • González-Rouco, J.F., H. Beltrami, E. Zorita, and H. von Storch, 2006: Simulation and inversion of borehole temperature profiles in surrogate climates: spatial distribution and surface coupling. Geophys. Res. Letters 33, doi:10.1029/2005GL024693 • Rybski, D., A. Bunde, S. Havlin,and H. von Storch, 2006: Long-term persistence in climate and the detection problem. Geophys Res. Lett. (in press)
Recent "global" near-surface air temperature anomalies Courtesy of Philip Brohan, Hadley Centre
Comparison between simulations and real reconstructions Not a specific result of ECHO-G
For the purpose of testing reconstruction methods, it does not really matter how „good“ the historical climate is reproduced by a millennial simulation. Such model data provide a laboratory to test MBH, Moberg, borehole inversion and other methods as well as hypothesis like “McMc”.
Training with trend • In our test of MBH in science (2004), the trend in the calibration period was taken out. • When the trend during the calibration period is used as a critical factor in the empirical reconstruction model, then the contamination of the proxy trend by non-climatic signals must be mimicked. • Thus, we introduced an error on the centennial time scale as red noise. • Here: 50% centennial,75% year-to-year. • Again heavy underestimation of long-term variability.
Claim: MBH was not built for such large variations as in Erik-I But – the same phenomenon emerges in a control run.
Testing Moberg’s method CPS: simple average of normalized proxies, then rescale to instrumental NHT variance Testing the Moberg method in the laboratory of ECHO-G. The inflation is done using 80-year filtered data. Solid: Northern Hemisphere temperature simulated in ECHO-G Light: Several reconstructions obtained when feeding Moberg's method with local temperature records, which have been contaminated with centennial noise (signal-to-noise ratio: 1)
González-Rouco et al., 2006, GRL Testing the method of inverting borehole temps Forward model simulations of borehole temperature profiles with SAT at all NH grid points (light shading) and at selected borehole grid points. 21 year low pass filter of SAT and inverted (forward modelled) borehole temperatures
We conclude • MBH98 underestimates low-frequency variability. • Moberg does a reasonable job (maybe fortuitously). • Borehole temperatures reconstructions provide reasonable estimates, albeit heavily smoothed.
No sulfate aerosols Does the controversy about the methodology in reconstructing historical temperature variations have a bearing on the claims that an anthropogenic signal is detectable in the recent temperature change? NO
Historical Reconstructions – their significance for “detection” • - Statistics of ΔTL,m, which is the difference of two m-year temperature means separated by L years. • - Temperature variations are modelled as Gaussian long-memory process, fitted to the various reconstructions. Rybski, D., A. Bunde, S. Havlin,and H. von Storch, 2006: Long-term persistence in climate and the detection problem. Geophys Res. Lett. (in press)
Temporal development of Ti(m,L) = Ti(m) – Ti-L(m) divided by the standard deviation (m,L) of the considered reconstructed temp record for m=5 and L=20 (top), andfor m=30 and L=100 years. The thresholds R = 2, 2.5 and 3 are given as dashed lines. Bunde et al., GRL, 2006, in press
The mystery of the expected error of reconstruction From Gerber, Joos, Brügger, Stocker, Mann, Sitch and Scholze, Climate Dynamics, 2003 From IPCC TAR (2001)
What is the current scientific consensus on the temperature record of the last 1,000 or 2,000 years? What are the main areas of uncertainty and how significant are they? What is the current scientific consensus on the conclusions reached by Drs. Mann, Bradley and Hughes? What are principal scientific criticism of their work and how significant are they? Has the information needed to replicate their work been available? Have other scientists been able to replicate their work? How central is the debate over the paleoclimate temperature record to the overall consensus on global climate change? How central is the work of Drs. Mann, Bradley and Hughes to the consensus on the temperature record? There is consensus on the “blade”, but the claimed smoothness of the shaft is likely false. The main problem is the loss of information encoded in the proxy data and the shortness of the instrumental record for training the statistical models. There is no consensus on the claims (which?) made by MBH. The main critique is that the method is suffering from a too large loss of variability on long time scales. No, the information required for replication was not made available in a suitable manner. The original publication in “nature” did not provide this information and was obviously published without careful review of the methodology. Yes, the details of the method were finally determined, among others by Bürger et al., who checked a wide range of combinations of details – which all gave widely different results. The main conclusions about “detection and attribution” are drawn from the instrumental record and models; the different reconstructions do not contradict “detection”. The MBH work is widely accepted as truth outside of people directly engaged in the issue, because of a less than satisfactory marketing by the IPCC. Rep. Boehlerts questions:
Additional relevant literature Bürger, G., I. Fast, and U. Cubasch, 2006: Climate reconstruction by regression - 32 variations on a theme, Tellus 58A, 227-235. Bürger, G., and U. Cubasch, 2005: Are multiproxy climate reconstructions robust? Geophs. Res. Lett. 32, L23711, doi:10.1029/2005GL024155
See also, von Storch, H. and N. Stehr 2005: • A Climate of Staged Angst, http://sciencepolicy.colorado.edu/prometheus/archives/climate_change/000343a_climate_of_staged_.html • Et klima af iscenesat frygt. Vejret 10, 39-42 • Geënsceneerede klimaatangst. Natuur, Wetenschap & Techniek 73, 44-46 • Klima inszenierter Angst. SPIEGEL 4/2005, 160-161
GCM: ECHO-G Model description • Atmospheric component • (MPI Rep. 218, 1996) • ECMWFMPI • ~ECHAM3 • + fresh water on glaciers • + river runnoff + partial ice cover • T30 ~ 3.75 x 3.75 ºlat x ºlon • 19 vertical levels: • Highest: 10 hPa~ 30 km • Lowest:~ 30 m • Coupler • (CERFACS Rep. CMGC/98-05, 1998) • Coupling: 1 day • Atm Oce: Heat, fresh watter, momentum fluxes • Oce Atm: Surface conditions • Grid interpolation • Ocean component • (DKRZ Rep. 13, 1997) • Prim. Eq. & Thermodyn. • + sea ice model with snow cover • Gauss. T42 ~ 2.8 x 2.8 ºlat x ºlon • 0.5 ºlat x ºlon Equator • 20 levels
GCM: ECHO-G Land-Sea Mask T30 resolution Soil model Extension of Warrilow et al., 1986 Met. Off. Tech. Note, 38. Z=0 m Soil processes: T(z) soil Snow pack Soil hidrology T1= 0.065 m T2= 0.319 m T3= 1.232 m T4= 4.134 m T5= 9.834 m
Forcing is not particularly strong • Sensitivity of ECHO-G about 2.5K Different reconstructions of solar irradiance
ECHO-G simulations „Erik den Røde” (1000-1990) and “Christoph Columbus” (1550-1990) with estimated volcanic, GHG and solar forcing
Remind: only coarse stratosphere, no ozone (ECHO-G)