Download
1 / 9
90 likes | 212 Views
Formulae. For each severity adjustment entity, X i = i th test result in original units in end-of-test order T i = i th test result in appropriate units in end-of-test order (T i = X i unless a transformation is used in which T i = transformed(X i ))

E N D
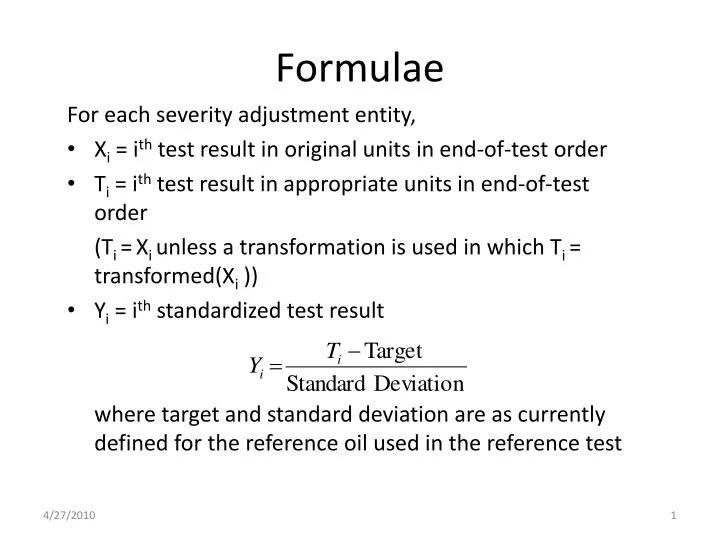
Formulae For each severity adjustment entity, • Xi = ith test result in original units in end-of-test order • Ti = ith test result in appropriate units in end-of-test order (Ti =Xi unless a transformation is used in which Ti = transformed(Xi )) • Yi = ith standardized test result where target and standard deviation are as currently defined for the reference oil used in the reference test
Formulae (continued) For each severity adjustment entity, • Zi = EWMA For default LTMS, λ = 0.2 Fast start is used, i.e., Z0 = average of Y1 , Y2 , and Y3 • ei = prediction error from EWMA
LTMS 2nd Edition Flowchart: Target Development New Test or Oil Development Select reference oils Develop precision study and/or Industry Matrix in multiple stages to run Reference oils at or around pass limit? No Does study cover sufficient range of technologies, base oils and grades? Statistical analysis of matrix data Yes No Set reference oil targets based on statistical analysis Run matrix stage Calibration A Consider labs and stands for calibration Yes No Any major problems in which study cannot continue? Does study cover sufficient range of labs, stands, engines and test sources of variability? Yes No No No Do the potential reference oils in the study meet chemical and physical constraints of the category? Does study adequately address questions of interest? Yes Yes Yes Run matrix stage
LTMS 2nd Edition Flowchart: Calibration A Reference Test Lab based severity adjustment system? Is this a new stand? This is a stand based severity adjustment system No No Status E C Yes Yes Is the test lab calibrated (existing lab)? Run 3 valid reference or matrix tests in the stand uninterrupted by non-reference tests No This is the first test stand in the lab Set Z0 = Average of first 3 test results in the reference entity ei F B Yes Did the reference test exceed the ei Level 1 limit for any prediction error monitoring parameter? Is this a new stand in a lab? Yes No Run one reference test No Yes Status E D Run one reference test
LTMS 2nd Edition Flowchart: Status E Has it been more than 2 years since the last acceptable reference test in the stand? Lab based severity adjustment system? Calibration C Yes No No Yes Is a planned reference oil reblend or primary part or fuel being introduced with a reference test? Yes Calibration B No Calibration D
LTMS 2nd Edition: Monitoring (ei) Charts F A Did the last reference test exceed the ei Level 3 limit on any prediction error monitoring parameters? | Yi – Yi+1 | ≤ ei Level 3 limit? Conduct one more reference test in stand that triggered alarm. Do not update charts. Yi = original value Update charts Yes Yes No “Do I Believe It?” Analysis Yi-Yi+1> ei Level 3 limit and Yi> Zi-1 ? No Yi = (ei Level 3 limit + Zi-1) Update charts Yes No Did the last reference test exceed the ei Level 2 limit on any prediction error monitoring parameters? Calibration period (number of tests) is 0.80 x standard calibration period Yes No Yi-Yi+1< - ei Level 3 limit and Yi≤ Zi-1 ? Yi = (-eiLevel 3 limit+ Zi-1) Update charts Yes Zi G No No A
G LTMS 2nd Edition: Adjustment (Zi) Charts Did the last reference test exceed the Zi Level 2 limit? Is this a lab based severity adjustment system? Conduct one more reference test in stand that triggered alarm or in the stand that is next due for calibration. Yes Yes ei F No No Conduct one more reference test in stand that triggered alarm. For all prediction error monitoring parameters Did previous valid test (sequencei-1) accomplish calibration and | ei | ≤ .50 and | Zi | ≤ .50? Did previous valid test (sequencei-1) accomplish calibration and | ei | ≤ 0.50 ? Did the last reference test exceed the Zi Level 1 limit? No No No Severity Adjustment No Yes Yes Yes Two or more invalid ref tests in calibration sequence in the same stand? Calibration period (number of tests) is 1.4 x standard calibration period Calibration period (number of tests) is 1.2 x standard calibration period Calculate SA = -Zix industry approved SA standard deviation No Yes Stand is calibrated
Flowchart Symbol Legend • Terminal Point: start, stop, interrupt, delay • Process: Defined operation • Decision: Switching operation that determines a number of alternative paths • Offpage Connector: enter or exit from a page • Connector: Exit to, or entry from, another part of a page