Download
1 / 16
160 likes | 273 Views
Evaluation of Potential Overland Flow and Pathway of Accidental Spills from Unconventional Drilling Sites to Nearby Streams . Yue Han, Sina Arjmand , Cesar A. Simon Jorge D. Abad Radisav Vidic , Sue Brantley Julie Vastine , Candy Wilderman ShaleNetwork team. Simon et al. (submission).

E N D
Evaluation of Potential Overland Flow and Pathway of Accidental Spills from Unconventional Drilling Sites to Nearby Streams Yue Han, SinaArjmand, Cesar A. Simon Jorge D. Abad RadisavVidic, Sue Brantley Julie Vastine, Candy Wilderman ShaleNetwork team
Simon et al. (submission) Motivation - Every 2Km we need a sensor - 7800 gas well (PA) - We need 50,000 sensors!
What we have? • Data for wells (Whole Pennsylvania) --- PADEP • DEM (Digital Elevation Model 10m,30m,90m) --- GLCF & PASDA • Stream Network (Pennsylvania) --- PASDA • Soil Type (Pennsylvania) --- PASDA • Land Cover (Pennsylvania) --- PASDA • Violations (Pennsylvania) --- PADEP • HUC 8, 10, 12 (Pennsylvania) – Hydrologic Unit Code --- USDA http://www.portal.state.pa.us/portal/server.pt/community/oil_and_gas_reports/20297 http://www.landcover.org/ http://www.pasda.psu.edu/uci/MetadataDisplay.aspx?entry=PASDA&file=netstreams1998.xml&dataset=16 http://www.pasda.psu.edu/data/soils/ http://datagateway.nrcs.usda.gov/GDGOrder.aspx
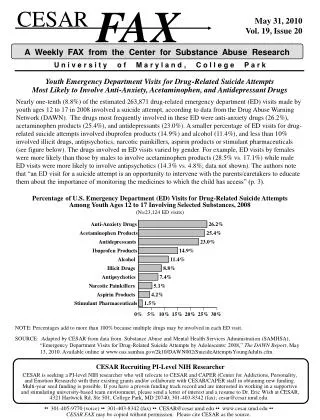
Figure 1 Figure 1: Location of permitted wellsFigure 2: Location of violations Figure 2
Cost Path Analysis • DEM • Slope • Reclassify • Weight (Percent Influence for Slope, Soil type, land cover, etc.) • Cost Distance • Cost Path
Sensitivity Analysis DEM 30m DEM 10m DEM 90m
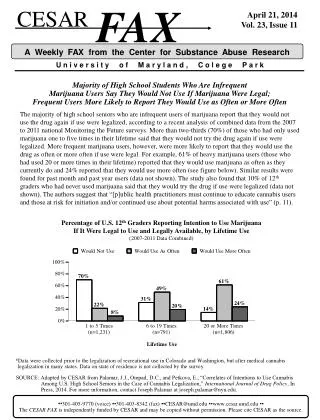
(a) (b) Figure 3:a)Slope computed from DEM 90-meter resolution b)Reclassification of soil c)Reclassification of land cover d)Reclassification of slope (c) (d)
Weighted Overlay Result Table 1: Percentage for Influencing Factors Analytic Hierarchy Process (AHP) is a decision-making system based
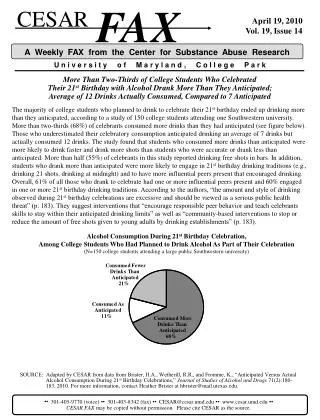
Cost Path Analysis for Pennsylvania (a) (b) Figure 4a)Cost path results 4b)the least cost path from drilling sites to nearby streams for East Branch Wyalusing Creek
Overland Flow Equation • Velocity: Manning’s Equation V=1/n R2/3S1/2 V—Velocity (meter/second) R—Hydraulic Radius (assuming R=0.122m) S—Slope n– Dimensionless Number that Characterizes the Flow Resistance (assuming n=0.05) Table 2: Manning's Roughness Coefficient Values(ODOT Hydraulics Manual, 2011) Will Farrar, Chris Galagan, TatsuIsaji, Kelly Knee, GIS Technology Applied to Modeling Oil Spills on Land
(a) (b) Figure 5(a) number of 1% shortest time wells per HUC10 (b) number of 3% shortest time wells per HUC10 (c) number of 5% shortest time wells per HUC10 (d) number of 10% shortest time wells per HUC10 (c) (d)
(a) (b) Figure 6(a) normalization of # 1% shortest time wells / permitted wells per HUC 10 (b) normalization of # 3% shortest time wells / permitted wells per HUC 10 (c) normalization of # 5% shortest time wells / permitted wells per HUC 10 (d) normalization of # 10% shortest time wells / permitted wells per HUC 10 (c) (d)
Conclusions • This studyintegrated topography and physical characteristics of PA into potential risk analysis of surface water contamination by shale gas fluids. Cost path analysis is the major technique used in the assessment. • This methodology could be used to start monitoring critical watersheds • This study could serve as sensor placement design across whole Pennsylvania.