Download
1 / 19
190 likes | 306 Views
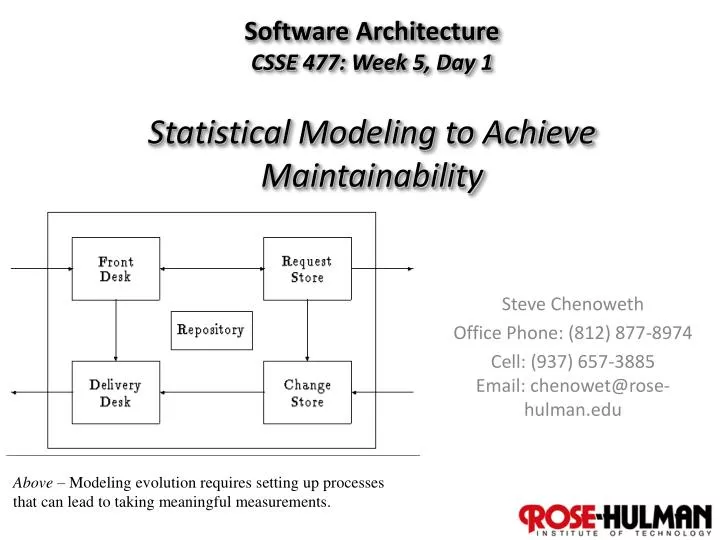
Software Architecture CSSE 477: Week 5, Day 1 Statistical Modeling to Achieve Maintainability. Steve Chenoweth Office Phone: (812) 877-8974 Cell: (937) 657-3885 Email: chenowet@rose-hulman.edu.

E N D
Software ArchitectureCSSE 477: Week 5, Day 1Statistical Modeling to Achieve Maintainability Steve Chenoweth Office Phone: (812) 877-8974 Cell: (937) 657-3885Email: chenowet@rose-hulman.edu Above – Modeling evolution requires setting up processes that can lead to taking meaningful measurements.
Maintainability? • Bass’s “Modifiability” attribute really links CSSE 477 back to 375, where we discussed in depth how to achieve this almost synonymous virtue. • As usual, Bass focuses on things about the design itself that can achieve this. • As was true with availability / reliability, we’re going to finish up by also discussing process. • What do you have to DO in terms of activities on a team, to make modifications easier / faster?
Statistical Modeling • Having meaningful numbers about the evolution and maintainability of a system • Leads into Measurable Maintainability (reference CSSE 375) • Starting point – can we measure the pieces of the horseshoe model? • Next step – can we explain / relate these results to the process used? • Then – can we change that process and investigate differences? The traditional horseshoe model – really for large-scale changes, but also applicable to regular maintenance.
What to model / measure? • Typically – bugs reported, time taken to fix a bug, etc. • Need to analyze these holistically, with people who know what’s going on. • Also need to know goals of each process. • E.g., knowing time to fix different bugs leads to setting-up service contracts. • Need to take both kinds: • In-process metrics • End-goal metrics
Typical scenario – includes customer contact time! Time taken for each of these internal processes forms the in-process metrics: These should be controlled by an organisation to achieve the end-goal metrics. Corrective Maintenance ProblemReporting Problem Resolution Fix Distribution Difference between these two frames is an end-goal metric, which is customer-mandated and externally dictated
Terminology • Measurement = the raw data • Metrics & statistics = derived calculations • Modeling = underlying analysis of what influences what • Looking at these tends to cycle: • E.g., Data on defects calculated “defect density” comparison with expectations or history looking at more specific data to find causes
Based on a quality management model … • Every development team needs metrics goals: • Short term • Long term • And a roadmap for how to get there. • Can’t just be “try harder.” • Falls in line with the Deming plan: • Plan Do Check Act
Deming applied to swre evolution - 1 Plan = • Anticipate workload • Stipulate end goals, service contracts • Staff appropriately • Design the processes for problem resolution
Deming applied to swre evolution - 2 Do = • Provide training • Carry-out reporting, resolution and fix distribution activities • Collect appropriate metrics
Deming applied to swre evolution - 3 Check = • Periodically check end-goal and in-process metrics • If you have a project manager whose main job this is, “periodically” can mean “daily”
Deming applied to swre evolution - 4 Act = • Modify processes • Replan • Keys – like managing other processes: • What is your goal and where do you want to go? • What is your current position • Knowing where you are and where you want to go, what steps should you take?
Typical metrics strategy • Decide what you want to measure and how to measure it. • See next slide • Set targets and track them. • Likely includes both qualitative and quantitative • Targets should be “SMART” • Understand variability, work towards minimising variability. • Consistency = predictability • Well-known stats should have upper and lower bounds • Variabilities need to be studied for root causes • Act on data and strive for continuous improvement. • Consider the human angle. • Hard to measure people’s “progress” like a machine’s.
What to measure • Is this measurement relevant to the project? • E.g., Maybe portability isn’t relevant to the first release… • Is it easy to measure? • Ideal is “no extra effort” to measure. • E.g., can it come automatically from the repository? • Is it one of the most valuable things to measure? • Can we quantify the costs / benefits of measuring it? • Is it controllable? • Can you afford NOT to measure it?
Common measurements - 1 • Mean time between failures = average time between arrival of bugs. • Can be calculated from defect repository. • Mean time to repair = Avg time to fix a bug; indicates responsiveness to bugs and effectiveness in fixing problems that are not reported. • Can be calculated from defect repository.
Common measurements - 2 • Number of problems responded to by “first level support” = The effectiveness of that level, implies number of interruptions to development team. • Can be calculated from Customer Support Repository • Classification of defects by severity = The nature of incoming problems. Measures the demand on support and maintenance resources. • Can be calculated from Defect Repository.
Common measurements - 3 • Classification of defects by product component = Problem-prone parts of a product, and hence points to areas of the product that need to be looked into more carefully. • Can be calculated from the Defect Repository
Best practices in metrics • Automate the process via repositories. • Integrate metrics into operational decision-making, not just as a collection mechanism. • Overdosing on metrics – not good! • Decide what to measure first. • Use for performance appraisal. • Oh, wait – Don’t do that. • Make it a closed loop. Data fire hose in action
Article on Measuring Evolution • Tom Arbuckle, “Measuring Software – and its Evolution – Using Information Content,” 2009. • Idea – to examine evolution, need to measure related artifacts over time. • Thesis – relative Kolmogorov complexity is the correct fundamental measurement. • “Algorithmic entropy” • Measures number of bits of information in an object. Above - And here he is, the father of information theory – Claude Shannon.
Article, cntd • “Information size is highly correlated with counting size”. • Given that many SE metrics count features representative of software artifacts - lines, methods, calls - we claim that this result provides some evidence both for our argument but also for those who may claim that existing metrics are good enough. • In the rest of the paper, they try to find good ways to measure the Kolmogorov complexity in software programs! (E.g., section 3.1.)