Download
1 / 37
370 likes | 518 Views
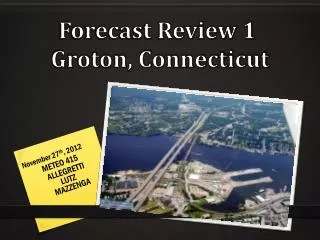
Groton Data Day. Accountability, Performance, and Balanced Assessments. Facilitated by:. Neal Capone District Data Coordinator CNYRIC. Agenda. Grounding – Spring Synectic Data Literacy – Accountability and Assessment 3-8 ELA/Math Collaborative Learning Cycle Score Trend Comparison

E N D
Groton Data Day Accountability, Performance, and Balanced Assessments Facilitated by: Neal Capone District Data Coordinator CNYRIC
Agenda • Grounding – Spring Synectic • Data Literacy – Accountability and Assessment • 3-8 ELA/Math Collaborative Learning Cycle • Score Trend Comparison • Cohort Trend and Subgroup Performance • Balanced Assessment • Rick Stiggens • Self-Evaluation
nySTART DataMentor Level 1 Container COGNOS Data Warehouse (Level 1) IEP Direct NutriKids/ Transfinder Data Flow Level 2 Repository (SED) PD Data System SIS (Student Management System)
Synectic What are some popular Spring Activities?
SYNECTIC Syn (bring together) Ectic (diverse elements) Data Analysis is like … because ...
Grounding Exercise • Name • Position • Share your Synectic
“Using data effectively does not mean getting good at crunching numbers. It means getting good at working together to gain insights from student-assessment results and to use the insights to improve instruction.”- Kathryn Boudett, Elizabeth City, & Richard Murnane, “When 19 Heads Are Better Than One,” Education Week, December 7, 2005.
Word Splash Work with a partner to define as many terms as you can on the Word Splash
Word Splash SIRS Participation Rate BEDS Summative Assessment Formative Assessment Graduation Cohort AMO NYSAA Performance Index NYSESLAT AYP Accountability Subgroups Scale Score --- Raw Score COGNOS Data Warehouse Triangulating Data Standards-Referenced Test Differentiated Accountability Sampling Principle Effective AMO Continuous Enrollment AVR NYSSIS Accountability Cohort Safe Harbor
Calculation of the Performance Index (PI) A Performance Index (PI) is a value from 0 to 200 that is assigned to an accountability group, indicating how that group performed on a required State test (or approved alternative) in English language arts, mathematics, or science. PIs are determined using the following equations: Elementary-Middle Levels: PI = [(number of continuously enrolled tested students scoring at Levels 2, 3, and 4 + the number scoring at Levels 3 and 4) ÷ number of continuously enrolled tested students] X 100 Secondary Level: PI = [(number of cohort members scoring at Levels 2, 3, and 4 + the number scoring at Levels 3 and 4) ÷ number of cohort members] X 100
Level 1: 5 students Level 2: 15 students Level 3: 45 students Level 4: 10 students PI = (15+45+10) + (45 + 10) 75 PI = 167 X 100
Effective AMOs An Effective AMO is the lowest PI that an accountability group of a given size can achieve in a subject for the group’s PI not to be considered significantly different from the AMO for that subject. If an accountability group's PI equals or exceeds the Effective AMO, the group is considered to have made AYP. Further information about confidence intervals and Effective AMOs is available at: http://www.emsc.nysed.gov/irts/school-accountability/confidence-intervals.htm
2010–11 Safe Harbor Calculation for ELA and Math Safe Harbor is an alternate means to demonstrate AYP for accountability groups whose PI is less than their Effective AMO. The Safe Harbor Target calculation for ELA and Math for 2010-11 using the 2009-10 PI is: Safe Harbor Target = {2009-10 PI} + [(200 – {2009-10PI}) 0.10]* For a group to make safe harbor in English or math, it must meet its Safe Harbor Target and also meet the science (at the elementary/middle level) or graduation rate (at the secondary level) qualification for safe harbor. To qualify at the elementary/middle level, the group must make the State Standard or its Progress Target in science in grades 4 and/or 8. At the secondary level, it must make the State Standard or its Progress Target for graduation rate.
DifferentiatedAccountability Model Phase FAILED AYP 2 YEARS FAILED AYP 2 YEARS Category Diagnostic Plan/Intervention Oversight & Support Intensity of Intervention
Word Splash SIRS Participation Rate BEDS Summative Assessment Formative Assessment Graduation Cohort AMO NYSAA Performance Index NYSESLAT AYP Accountability Subgroups Scale Score --- Raw Score COGNOS Data Warehouse Triangulating Data Standards-Referenced Test Differentiated Accountability Sampling Principle Effective AMO Continuous Enrollment AVR NYSSIS Accountability Cohort Safe Harbor
Managing Modeling Mediating Monitoring Data-Driven DialogueThe Collaborative Learning Cycle
Andrew Lang (1844-1912) In reference to an individual who misuses data: "He uses statistics as a drunken man uses lamp-posts... …for support rather than illumination."
Data-Driven DialogueThe Collaborative Learning Cycle Activating and Engaging • What are some predictions • we are making? • With what assumptions are • we entering? • What are some questions • we are asking? • What are some possibilities • for learning that this • experience presents to us? Managing Modeling Mediating Monitoring
What is a prediction you made? What might be some assumptions that influenced your prediction?
Data-Driven DialogueThe Collaborative Learning Cycle Managing Modeling Mediating Monitoring • What important points seem to “pop out”? • What are some patterns, categories, or trends that are emerging? • What seems to be surprising or unexpected? • What are some things we have not yet explored? Exploring and Discovering
Principles of Data-Driven Dialogue • Importance of Predictions • Conscious Curiosity • Purposeful Uncertainty • Visually Vibrant Information • Third Point
Data-Driven DialogueThe Collaborative Learning Cycle Managing Modeling Mediating Monitoring • What important points seem to “pop out”? • What are some patterns, categories, or trends that are emerging? • What seems to be surprising or unexpected? • What are some things we have not yet explored? Exploring and Discovering
Managing Modeling Mediating Monitoring Data-Driven DialogueThe Collaborative Learning Cycle • What inferences/ explanations/ conclusions might we draw? • What additional data sources might we explore to verify our explanations? • -------------------------------------------------- • What are some solutions we might explore . . . ? • What data will we need to collect to guide implementation? Organizing and Integrating
“My team has created a very innovative solution, but we’re still looking for a problem to go with it.”
Causal Arenas • Curriculum • Instructional methods and materials • Teacher knowledge and skills • Student readiness • Infrastructure
Managing Modeling Mediating Monitoring Data-Driven DialogueThe Collaborative Learning Cycle • What inferences/ explanations/ conclusions might we draw? • What additional data sources might we explore to verify our explanations? • -------------------------------------------------- • What are some solutions we might explore . . . ? • What data will we need to collect to guide implementation? Organizing and Integrating
Time to Share • Share ONE observation • Share ONE theory of causation • Share additional data sources that you would want to explore to confirm or disprove your theory