Download
1 / 23
230 likes | 358 Views
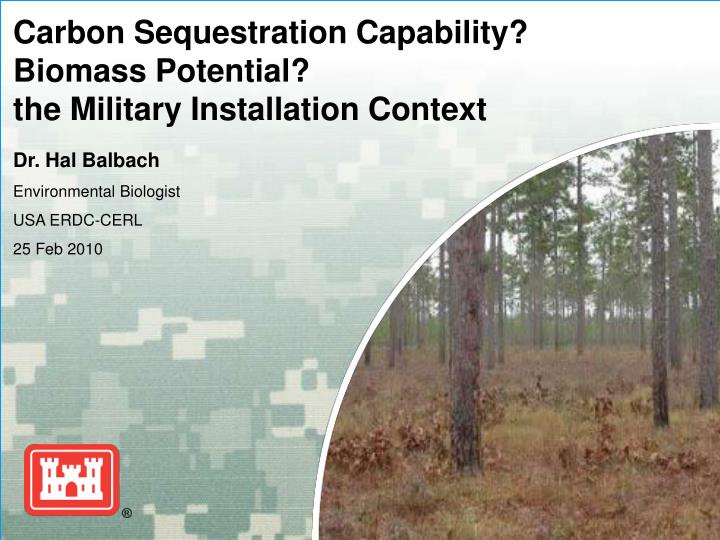
Carbon Sequestration Capability? Biomass Potential? the Military Installation Context. Dr. Hal Balbach Environmental Biologist USA ERDC-CERL 25 Feb 2010. What are our land uses?. “Mission needs” is the standard answer A complicated picture Need space on land, sea, and air

E N D
Carbon Sequestration Capability?Biomass Potential?the Military Installation Context Dr. Hal Balbach Environmental Biologist USA ERDC-CERL 25 Feb 2010
What are our land uses? • “Mission needs” is the standard answer • A complicated picture • Need space on land, sea, and air • Active training on most lands • Safety setbacks and buffers for others • Both are equally important
Carbon and BiomassWhat are the DoD needs? • Military installations ca 25 million acres • Corps water projects another 15 million ± • Roughly 50% are forest/woodland • BRAC process has reduced number of active installations recently • MISSIONS have not been reduced • Operation intensity has increased on remaining installations
Many animal (and plant) species are officially listed as threatened or endangered at the state or Federal level, and many more are considered at-risk of being so listed. Gopher tortoise (Gopherus polyphemus) Pine snake (Pituophis melanoleucus) Red-cockaded woodpecker (Picoides borealis) Carphephorus bellidifolius (Sandywoods chaffhead) Bachman’s sparrow (Aimophila aestivalias) Astragalus michauxii (Sandhills milkvetch) Striped Newt (Notophthalmus perstriatus) SE Pocket gopher (Geomys pinetis) Eastern indigo snake (Drymarchon corais couperi) SE Kestrel (Falco sparverius paulus) Stylisma pickeringii (Pickering morning-glory) Warea cuneifolia (Carolina pinelandcress) Gopher frog (Rana capito)
TES and SAR Concerns • Military installations support 200+ TES • Also have ca 170 SARs • Highest density of TES and SAR of any Federal land holding agency • 1000+ biologists working on the ground • Serious about stewardship missions • Spend ca $65 million/year on this
Biomass Concerns • How to determine potential demand? • What capital costs would be needed? • What about effect on land uses? • Training uses – realistic environment • Wildlife management requirements • Land restoration plans? • Who would prioritize? • Potential for Congressional pressures?
Carbon Budget/Capture Concerns • DoD is actively registering/measuring CO2 • Heating plants • Vehicles, aircraft, generators • They are not generally measuring terrestrial pools • Not clear what the requirement will be for terrestrial sequestration • Calculation protocol • Future management needs/requirements
The SERDP program funded a series of basic studies (1999 – 2009) which examined carbon budgets at Ft. Benning, GA Mostly looked at small study plots Some attempts to expand installation-wide One major study through USGS-EROS Another study (not research funded) was an offshoot of a CO2 management study of operations generation activities Some Exceptionswith respect to terrestrial carbon issues
ENVIANCE EXPANDS U.S ARMY’S DEPLOYMENT OF REAL-TIME GREENHOUSE GAS MANAGEMENT SYSTEM TO TWELVE BASES NATIONWIDE Success of Initial Fort Carson, Colorado, Program to Manage and Reduce the Army’s Carbon Footprint Prompts Further Deployments in Alabama, Georgia, Hawaii, Kentucky, Maryland, New York, Pennsylvania and Texas CARLSBAD, Calif. — Enviance, a proven provider of software solutions to help organizations manage carbon and other regulatory risks, today announced that the U.S. Army has expanded its deployment of the Enviance greenhouse gas (GHG) reporting and management system, which allows for real-time tracking and management of GHG emissions and energy intensity reductions as mandated by Executive Order 13423. Initially proven at Fort Carson in Colorado, the Enviance system is being rolled out to an additional 11 installations across the United States, including Fort Benning, Ga.; Letterkenny Army Depot, Pa.; Redstone Arsenal, Ala.; Fort Indiantown Gap, Pa.; Fort Rucker, Ala.; Fort Campbell, Ky.; Fort Hood, Texas; Fort Drum, N.Y.; Fort Stewart, Ga.; Aberdeen Proving Grounds, Md. and Schofield Barracks, Hawaii.
Enviance™ Procedure • Additional effort beyond original contract • Started with an installation inventory • Used reference data from Smith, Heath, and Woodbury, 2004, How to Estimate Forest Carbon for Large Areas from Inventory Data. • Values expressed as Mg C per ha • Broad regional values only ones used
USGS – EROS Study • Multi-year SERDP Project (SI-1642) • Broad biogeochemical focus • Example of combining several models and datasets • SSURGO • CENTURY • Several others • Implementation of GEMS system • Resulted in numerous papers by Zhao, Liu and others in 2009 - 2010
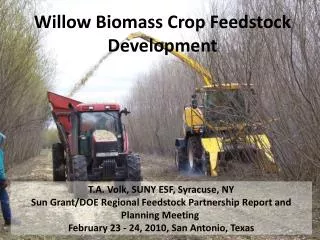
Tree density distribution From original inventory Liu, et al 2008
Distribution of aboveground biomass density among density classesFrom original inventory Liu, et al 2008
Modeling Carbon Sequestration and Greenhouse Gas Emissions, and Uncertainty Assessment Shuguang (Leo) Liu and GEMS Team U.S. Geological Survey Earth Resources Observation and Science (EROS) Center U.S. Department of the Interior U.S. Geological Survey
GEMS Inputs • Land cover change and disturbance maps • Land cover change (e.g., ag census data, GIS grid time series, or both) • Disturbances maps of extent and severity (fire, pests and insects, etc.) • Coefficients describing carbon flow among pools induced by disturbances • Soil and DEM data • GIS dataset such as SSURGO, STATSGO, FAO soil database • DEM data (USGS/EROS) • Stream networks (USGS/EROS), stream and nutrients flow (USGS) • Climate • GIS datasets of monthly precipitation, max and min temperature • To run EC-LUE: daily radiation/PAR, temperature, relative humidity, wind speed • Management Data • Crop composition, crop rotation probability (e.g., NRI) • Ag harvesting change in history (whole vs. grain only ...) • Tillage information • Nitrogen deposition map • Forest age distribution and biomass data • Selective cutting data by state • Timber production • Model setup • match table: land cover classes to model ecosystems (make GEMS very flexible)
Biogeochemical models (e.g., EDCM, CENTURY, BIOME-BGC) Land cover/use change model (e.g., FORE-SCE, CLUE) GEMS General Ensemble Biogeochemical Modeling System Input Data Module Data model fusion system Output Data Module In-situ and Census Data Vegetation data (FIA, USDA, etc) Spatially distributed characterization of ecosystem states and changes (e.g., carbon stocks and fluxes) with measure of uncertainty under various land use, management, and climate change scenarios Soil data Fluxnet data GEMS Data Assimilation Land cover and disturbances Land Surface Dynamics Ecosystem Performance (e.g., productivity) Assessment (e.g., carbon sequestration, risk, cost-benefit) Climate Change Scenarios IPCC, etc. Reporting by land management units, regions, and nation Land Use Scenarios Economic and management Scenarios
GEMS • A modeling system for spatially explicit simulation of biogeochemical cycling over large areas • Developed at USGS Earth Resources Observation and Science Center • Deployment of the encapsulated plot-scale model in space is based on a Joint Frequency Distribution of the major controlling variables (e.g., land cover, climate, soil, etc.). • Included data assimilation algorithms • It includes a dynamic land cover/use change submodel • Stochastic ensemble simulations to incorporate uncertainties in input data • Uncertainty estimate of carbon dynamics • Major applications (US, Africa, and Central America)
GEMS and Other Models GEMS is a modeling platform, originally designed to facilitate the deployment of classic site-scale models (e.g., CENTURY, DNDC, Biome-BGC, EDCM) in space. It uses two approaches to interact with encapsulated biogeochemical (BGC) models: • Agent Implementation. Any Model Interface (AMI) or agent is developed to implement the interface between any BGC model and GEMS. Agent Implementation avoids modifications to BGC models and can be very useful for sharing models that are hard to modify. • Direct Implementation. EDCM is merged with GEMS to allow running simulations of landscape and river transport, and also easier interactions with other modeling systems such as FORE-SCE. This direct implementation allows GEMS to run simulations in the space-time sequence rather than the original time-space sequence.
GEMS Outputs • Carbon stocks • Biomass C: root, stem, leaf and branch • Detritus/Litter • SOC: active, slow and passive • Ecosystem carbon stock • Ecosystem Carbon Fluxes and GHG Fluxes • 4Ps: GPP, NPP, NEP (NEE), NBP • Respiration • N2O and CH4 Fluxes • Fire induced carbon emission • Tree biomass removal • Grain yield • Crop straw removal • Lateral fluxes of C and N • Carbon trends and sensitivity to environmental factors • Carbon change through time • Carbon sensitivity to climate (precipitation, temperature) and atmospheric changes (CO2 concentration, Nitrogen deposition) • Carbon sensitivity to natural disturbance and human land use (fire, logging etc.) • Other outputs • Water balance (e.g, ET, run-off), hydrological routing and soil erosion/deposition
FORE-SCE Projected Land Cover Change from 1992 to 2050: Southeast U.S. FOREcasting SCEnarios of future land cover (FORE-SCE) model(Sohl and Sayler, 2008. Ecol Model)
Spatial Distribution of C Sequestration: FB vs. SUR Land Cover Change Carbon Sequestration
Carbon Sequestration: Fort Benning (FB) and Surrounding Area (SUR) • Average carbon sequestration rates for • FB vs. SUR: • Current (1992-2007): 76.7 vs. 18.5 g C m-2 yr-1 • Future (2008-2050): 75.7 vs. 25.6 g C m-2 yr-1 Different C sequestration rates caused by different land use change and practices.
Impacts of Spatial and Temporal Resolution of Land Cover Change Info