Download
1 / 1

E N D
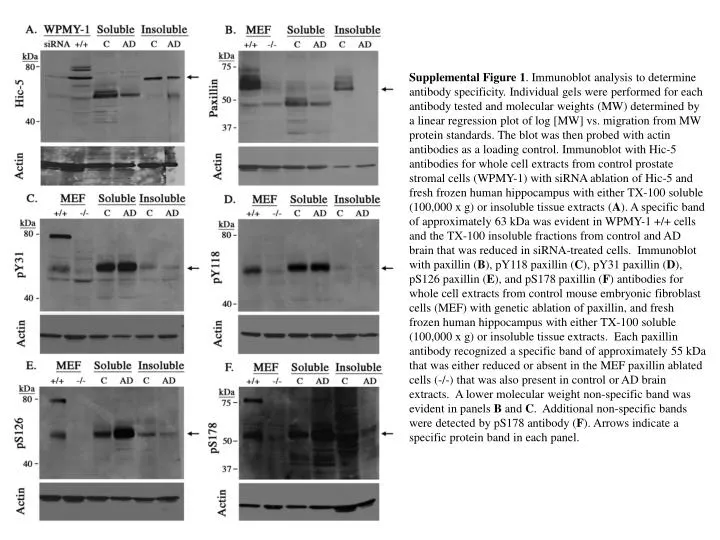
Supplemental Figure 1. Immunoblot analysis to determine antibody specificity. Individual gels were performed for each antibody tested and molecular weights (MW) determined by a linear regression plot of log [MW] vs. migration from MW protein standards. The blot was then probed with actin antibodies as a loading control. Immunoblot with Hic-5 antibodies for whole cell extracts from control prostate stromal cells (WPMY-1) with siRNA ablation of Hic-5 and fresh frozen human hippocampus with either TX-100 soluble (100,000 x g) or insoluble tissue extracts (A). A specific band of approximately 63 kDa was evident in WPMY-1 +/+ cells and the TX-100 insoluble fractions from control and AD brain that was reduced in siRNA-treated cells. Immunoblot with paxillin (B), pY118 paxillin (C), pY31 paxillin (D), pS126 paxillin (E), and pS178 paxillin (F) antibodies for whole cell extracts from control mouse embryonic fibroblast cells (MEF) with genetic ablation of paxillin, and fresh frozen human hippocampus with either TX-100 soluble (100,000 x g) or insoluble tissue extracts. Each paxillin antibody recognized a specific band of approximately 55 kDa that was either reduced or absent in the MEF paxillin ablated cells (-/-) that was also present in control or AD brain extracts. A lower molecular weight non-specific band was evident in panels B and C. Additional non-specific bands were detected by pS178 antibody (F). Arrows indicate a specific protein band in each panel.
