Download
1 / 1
10 likes | 124 Views
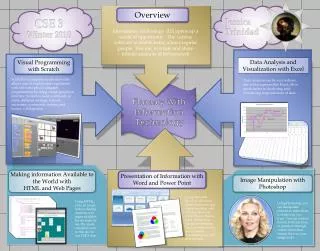
Journey in Computational Thinking By Denise Vo. Computational Thinking. Presentation of Information with MS PowerPoint. Visual Programming with Alice.

E N D
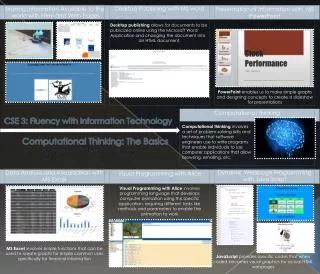
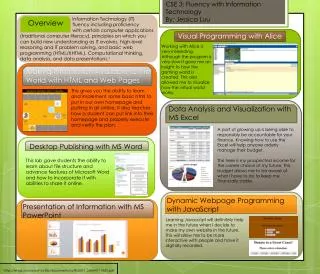
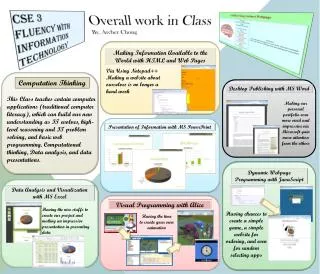
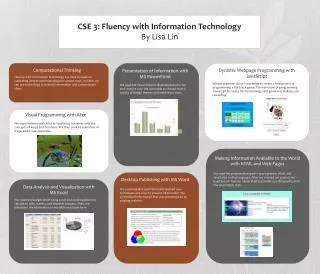
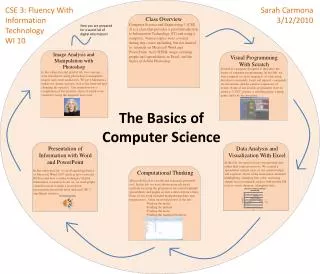
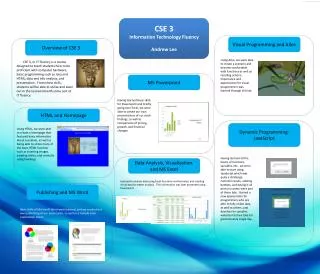
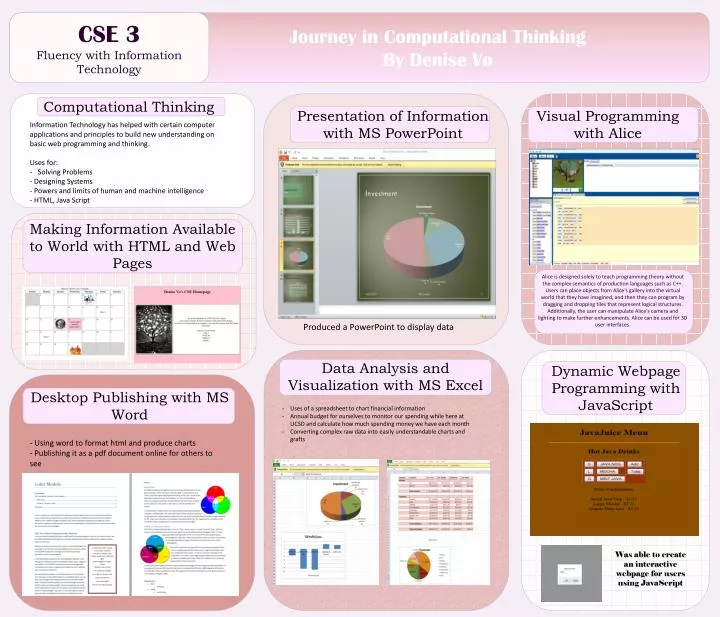
Journey in Computational ThinkingBy Denise Vo Computational Thinking Presentation of Information with MS PowerPoint Visual Programming with Alice • Information Technology has helped with certain computer applications and principles to build new understanding on basic web programming and thinking. • Uses for: • Solving Problems • - Designing Systems • - Powers and limits of human and machine intelligence • - HTML, Java Script CSE 3Fluency with Information Technology Making Information Available to World with HTML and Web Pages Alice is designed solely to teach programming theory without the complex semantics of production languages such as C++. Users can place objects from Alice's gallery into the virtual world that they have imagined, and then they can program by dragging and dropping tiles that represent logical structures. Additionally, the user can manipulate Alice's camera and lighting to make further enhancements. Alice can be used for 3D user interfaces. Produced a PowerPoint to display data Data Analysis and Visualization with MS Excel Dynamic Webpage Programming with JavaScript Desktop Publishing with MS Word • Uses of a spreadsheet to chart financial information • Annual budget for ourselves to monitor our spending while here at UCSD and calculate how much spending money we have each month • Converting complex raw data into easily understandable charts and grafts - Using word to format html and produce charts - Publishing it as a pdf document online for others to see Was able to create an interactive webpage for users using JavaScript