1 / 1

Lambs Creek at SR 67 Load Duration Curve (1996, 2001, 2002 Monitoring Data) Site: WWU160-0005

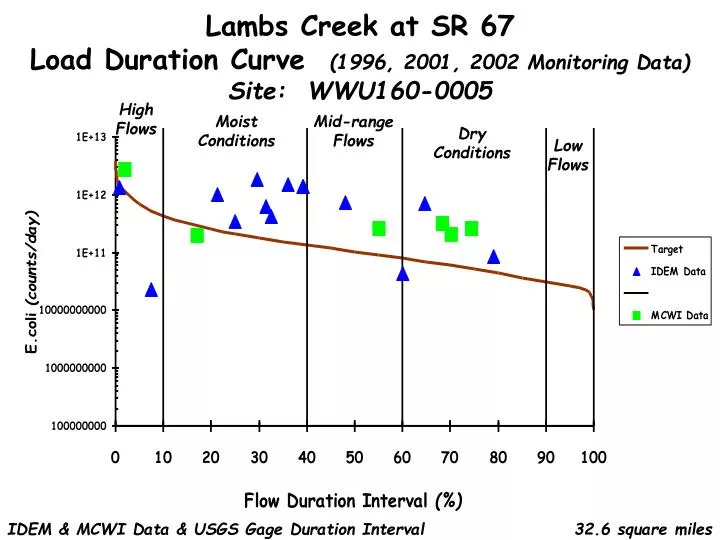
Lambs Creek at SR 67 Load Duration Curve (1996, 2001, 2002 Monitoring Data) Site: WWU160-0005. High Flows. Moist Conditions. Mid-range Flows. Dry Conditions. Low Flows. IDEM & MCWI Data & USGS Gage Duration Interval. 32.6 square miles.

satin
Download Presentation

Lambs Creek at SR 67 Load Duration Curve (1996, 2001, 2002 Monitoring Data) Site: WWU160-0005

An Image/Link below is provided (as is) to download presentation Download Policy: Content on the Website is provided to you AS IS for your information and personal use and may not be sold / licensed / shared on other websites without getting consent from its author. Content is provided to you AS IS for your information and personal use only. Download presentation by click this link. While downloading, if for some reason you are not able to download a presentation, the publisher may have deleted the file from their server. During download, if you can't get a presentation, the file might be deleted by the publisher.

E N D

Presentation Transcript


  1. Lambs Creek at SR 67 Load Duration Curve (1996, 2001, 2002 Monitoring Data)Site: WWU160-0005 High Flows Moist Conditions Mid-range Flows Dry Conditions Low Flows IDEM & MCWI Data & USGS Gage Duration Interval 32.6 square miles

More Related