Download
1 / 1
10 likes | 90 Views
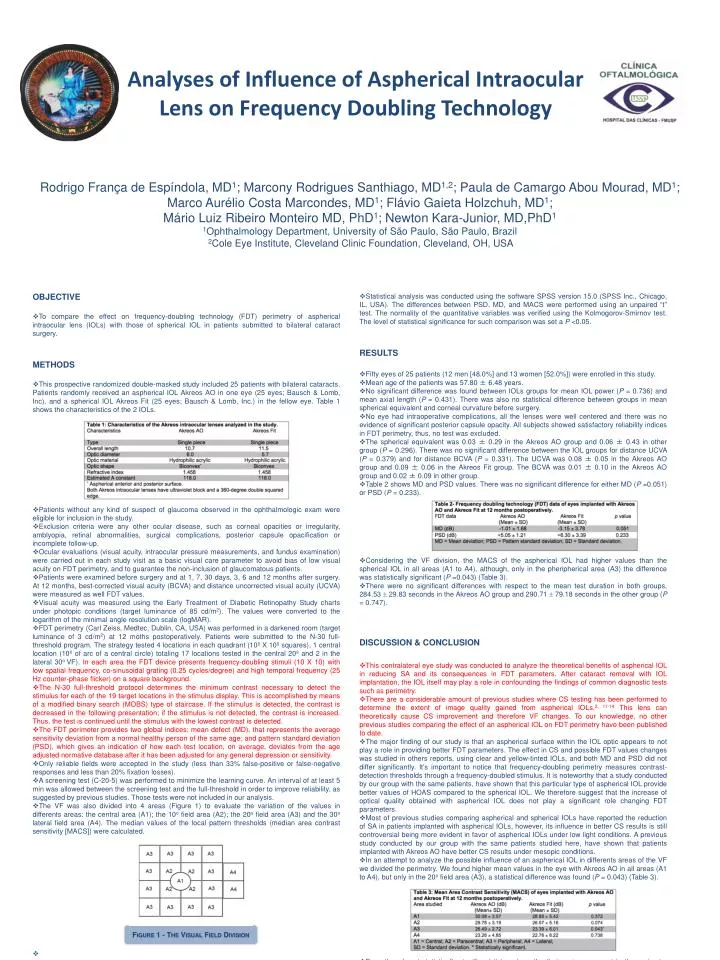
Rodrigo França de Espíndola , MD 1 ; Marcony Rodrigues Santhiago , MD 1,2 ; Paula de Camargo Abou Mourad , MD 1 ; Marco Aurélio Costa Marcondes, MD 1 ; Flávio Gaieta Holzchuh, MD 1 ; Mário Luiz Ribeiro Monteiro MD, PhD 1 ; Newton Kara-Junior , MD,PhD 1

E N D
Rodrigo França de Espíndola, MD1; Marcony Rodrigues Santhiago, MD1,2; Paula de Camargo Abou Mourad, MD1; Marco Aurélio Costa Marcondes, MD1; Flávio Gaieta Holzchuh, MD1; Mário Luiz Ribeiro Monteiro MD, PhD1; Newton Kara-Junior, MD,PhD1 1Ophthalmology Department, University of São Paulo, São Paulo, Brazil 2Cole Eye Institute, Cleveland Clinic Foundation, Cleveland, OH, USA • OBJECTIVE • To compare the effect on frequency-doubling technology (FDT) perimetry of aspherical intraocular lens (IOLs) with those of spherical IOL in patients submitted to bilateral cataract surgery. • METHODS • This prospective randomized double-masked study included 25 patients with bilateral cataracts. Patients randomly received an aspherical IOL Akreos AO in one eye (25 eyes; Bausch & Lomb, Inc), and a spherical IOL Akreos Fit (25 eyes; Bausch & Lomb, Inc.) in the fellow eye. Table 1 shows the characteristics of the 2 IOLs. • Patients without any kind of suspect of glaucoma observed in the ophthalmologic exam were eligible for inclusion in the study. • Exclusion criteria were any other ocular disease, such as corneal opacities or irregularity, amblyopia, retinal abnormalities, surgical complications, posterior capsule opacification or incomplete follow-up. • Ocular evaluations (visual acuity, intraocular pressure measurements, and fundus examination) were carried out in each study visit as a basic visual care parameter to avoid bias of low visual acuity on FDT perimetry, and to guarantee the non-inclusion of glaucomatous patients. • Patients were examined before surgery and at 1, 7, 30 days, 3, 6 and 12 months after surgery. At 12 months, best-corrected visual acuity (BCVA) and distance uncorrected visual acuity (UCVA) were measured as well FDT values. • Visual acuity was measured using the Early Treatment of Diabetic Retinopathy Study charts under photopic conditions (target luminance of 85 cd/m2). The values were converted to the logarithm of the minimal angle resolution scale (logMAR). • FDT perimetry (Carl Zeiss, Medtec, Dublin, CA, USA) was performed in a darkened room (target luminance of 3 cd/m2) at 12 moths postoperatively. Patients were submitted to the N-30 full-threshold program. The strategy tested 4 locations in each quadrant (10º X 10º squares), 1 central location (10º of arc of a central circle) totaling 17 locations tested in the central 20º and 2 in the lateral 30o VF). In each area the FDT device presents frequency-doubling stimuli (10 X 10) with low spatial frequency, co-sinusoidal grating (0.25 cycles/degree) and high temporal frequency (25 Hz counter-phase flicker) on a square background. • The N-30 full-threshold protocol determines the minimum contrast necessary to detect the stimulus for each of the 19 target locations in the stimulus display. This is accomplished by means of a modified binary search (MOBS) type of staircase. If the stimulus is detected, the contrast is decreased in the following presentation; if the stimulus is not detected, the contrast is increased. Thus, the test is continued until the stimulus with the lowest contrast is detected. • The FDT perimeter provides two global indices; mean defect (MD), that represents the average sensitivity deviation from a normal healthy person of the same age; and pattern standard deviation (PSD), which gives an indication of how each test location, on average, deviates from the age adjusted normative database after it has been adjusted for any general depression or sensitivity. • Only reliable fields were accepted in the study (less than 33% false-positive or false-negative responses and less than 20% fixation losses). • A screening test (C-20-5) was performed to minimize the learning curve. An interval of at least 5 min was allowed between the screening test and the full-threshold in order to improve reliability, as suggested by previous studies. Those tests were not included in our analysis. • The VF was also divided into 4 areas (Figure 1) to evaluate the variation of the values in differents areas: the central area (A1); the 10o field area (A2); the 20o field area (A3) and the 30o lateral field area (A4). The median values of the local pattern thresholds (median area contrast sensitivity [MACS]) were calculated. • Statistical analysis was conducted using the software SPSS version 15.0 (SPSS Inc., Chicago, IL, USA). The differences between PSD, MD, and MACS were performed using an unpaired “t” test. The normality of the quantitative variables was verified using the Kolmogorov-Smirnov test. The level of statistical significance for such comparison was set a P <0.05. • RESULTS • Fifty eyes of 25 patients (12 men [48.0%] and 13 women [52.0%]) were enrolled in this study. • Mean age of the patients was 57.80 ± 6.48 years. • No significant difference was found between IOLs groups for mean IOL power (P = 0.736) and mean axial length (P = 0.431). There was also no statistical difference between groups in mean spherical equivalent and corneal curvature before surgery. • No eye had intraoperative complications, all the lenses were well centered and there was no evidence of significant posterior capsule opacity. All subjects showed satisfactory reliability indices in FDT perimetry, thus, no test was excluded. • The spherical equivalent was 0.03 ± 0.29 in the Akreos AO group and 0.06 ± 0.43 in other group (P = 0.296). There was no significant difference between the IOL groups for distance UCVA (P = 0.379) and for distance BCVA (P = 0.331). The UCVA was 0.08 ± 0.05 in the Akreos AO group and 0.09 ± 0.06 in the Akreos Fit group. The BCVA was 0.01 ± 0.10 in the Akreos AO group and 0.02 ± 0.09 in other group. • Table 2 shows MD and PSD values. There was no significant difference for either MD (P =0.051) or PSD (P = 0.233). • Considering the VF division, the MACS of the aspherical IOL had higher values than the spherical IOL in all areas (A1 to A4), although, only in the pheripherical area (A3) the difference was statistically significant (P =0.043) (Table 3). • There were no significant differences with respect to the mean test duration in both groups, 284.53 29.83 seconds in the Akreos AO group and 290.71 79.18 seconds in the other group (P = 0.747). • DISCUSSION & CONCLUSION • This contralateral eye study was conducted to analyze the theoretical benefits of aspherical IOL in reducing SA and its consequences in FDT parameters. After cataract removal with IOL implantation, the IOL itself may play a role in confounding the findings of common diagnostic tests such as perimetry. • There are a considerable amount of previous studies where CS testing has been performed to determine the extent of image quality gained from aspherical IOLs.2, 11-14 This lens can theoretically cause CS improvement and therefore VF changes. To our knowledge, no other previous studies comparing the effect of an aspherical IOL on FDT perimetry have been published to date. • The major finding of our study is that an aspherical surface within the IOL optic appears to not play a role in providing better FDT parameters. The effect in CS and possible FDT values changes was studied in others reports, using clear and yellow-tinted IOLs, and both MD and PSD did not differ significantly. It’s important to notice that frequency-doubling perimetry measures contrast-detection thresholds through a frequency-doubled stimulus. It is noteworthy that a study conducted by our group with the same patients, have shown that this particular type of aspherical IOL provide better values of HOAS compared to the spherical IOL. We therefore suggest that the increase of optical quality obtained with aspherical IOL does not play a significant role changing FDT parameters. • Most of previous studies comparing aspherical and spherical IOLs have reported the reduction of SA in patients implanted with asphericalIOLs, however, its influence in better CS results is still controversial being more evident in favor of asphericalIOLs under low light conditions. A previous study conducted by our group with the same patients studied here, have shown that patients implanted with Akreos AO have better CS results under mesopic conditions. • In an attempt to analyze the possible influence of an aspherical IOL in differents areas of the VF we divided the perimetry. We found higher mean values in the eye with Akreos AO in all areas (A1 to A4), but only in the 20o field area (A3), a statistical difference was found (P = 0.043) (Table 3). • Even though not statistically significant it is noteworthy that an improvement in the perimetry values with such lens could mask the glaucoma diagnosis or lead to other diagnostic confusions, especially considering that the functional abnormalities detected by FDT perimetry were shown to be predictive of the future onset and location of VF loss among glaucoma suspect patients. • In this study, the MD was higher in the Akreos AO group, and the PSD was higher in the Akreos Fit group. Note that a more negative MD indicates visual performance worse than that expected from the normative database, and a higher PSD indicates greater changes in sensibility. However, both indices were not statistically significant between the two groups (Table 2). • It is not the purpose of the study and the design is also not appropriate to detect weakness of the test and therefore we believe it is not reasonable to assure that differences that may exist were not detected to due to lack of test sensitivity. • The fact that this study makes a contralateral comparison minimizes intraindividual factors that could interfere with the CS and the results of FDT perimetry. The visual system of the same patient was used as control, and major differences in retinal resolution, contrast transmission, and cortical perception were reduced to a minimum. Different IOL from the same manufacturer were utilized to minimize bias from different IOL materials. • In summary, FDT perimetry did not appear to be affected by aspherical IOL. Although a better trend was found in favor of patients implanted with aspherical IOL further studies should be carry out to confirm or not that hypotheses. Analyses of Influence of Aspherical Intraocular Lens on Frequency Doubling Technology Figure 1 - The Visual Field Division