Download
1 / 15
160 likes | 287 Views
Late-Season Prediction of Wheat Grain Yield and Protein. K.W. Freeman, W.E. Thomason, E.V.Lukina, G.V. Johnson, K.J. Wynn, J.B. Solie, M.L. Stone, and W.R. Raun. Oklahoma State University Department of Plant and Soil Sciences. Introduction.

E N D
Late-Season Prediction of Wheat Grain Yield and Protein K.W. Freeman, W.E. Thomason, E.V.Lukina, G.V. Johnson, K.J. Wynn, J.B. Solie, M.L. Stone, and W.R. Raun Oklahoma State University Department of Plant and Soil Sciences
Introduction • Pre-harvest prediction of wheat yield will assist producers • Provide more reliable field maps • Assist in pre-harvest marketing • Pre-harvest prediction of grain protein • Strong correlation between plant N and NDVI (Stone, 1996) • Determine whether or not to apply late-season N
Introduction • In order to describe the variability encountered in the field, soil, plant, and indirect measurements should be made at the meter or submeter level (Solie et al., 1999). • Field element size: area that provides the most precise measure of the available nutrient where the level of that nutrient changes with distance (Solie et al. 1996). • Willis (1999) defined yield maps as tools used by producers to look for general patterns and trends, and that yield monitor data could be corrected using remotely sensed data.
Objectives • To determine the relationship between spectral measurements taken from Feekes growth stages 9 to physiological maturity and grain yield and grain protein.
Ripening Stage Heading Stem Extension Growth Stages in Cereals Tillering
Materials and Methods • Seven experimental sites: • Stillwater, Lahoma, Hennessey, Perkins and Haskell, OK • Experimental design: • 4 experiments in long-term fertility trials, 2 anhydrous ammonia NUE trials and a Sewage Sludge loading experiment • 2 x 2 msubplots placed in existing experiments with differing N rates • Spectral reflectance readings taken with photodiode-based sensor with interference filters for red at 671±6 and near infrared (NIR) at 780±6 nm wavelengths
Materials and Methods • Experimental design (cont): • Readings were taken at Feekes growth stages 9, 10.5, 11.2, and 11.4 • Spectral indices were calculated for each subplot at all growth stages • Grain Production • Harvest of 2 x 2 m area with a self-propelled combine • Grain samples were ground to pass 120-mesh screen and analyzed for total N using Carlo-Erba 1500 dry combustion analyzer (Schepers et al., 1989)
Materials and Methods • Formulas for Spectral Indices • NDVI = NIR ref – red ref / NIR ref + red ref • INSEY = NDVI (each date) / days from planting • RI = DM yield of highest yielding plots / DM yield of check • ISRI = Highest NDVI / NDVI from check
Feekes 9 6000 5000 2 y = 2188.5x + 778.72x + 711.53 2 R = 0.46 4000 Yield kg ha-1 3000 2000 1000 0 0 0.1 0.2 0.3 0.4 0.5 0.6 0.7 0.8 0.9 1 NDVI
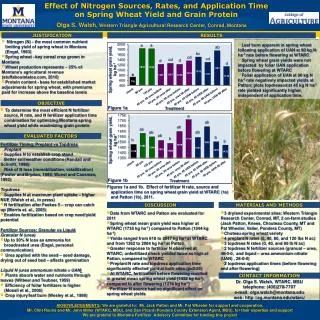
6000 5000 4000 3000 2000 1000 0 Feekes 9 R.I.<1.5 R.I.>1.5 6000 5000 2 2 y = 1628.6x + 1731.1x + 443.84 y = -2530.4x + 8204.1x - 2054.1 2 2 R = 0.69 4000 R = 0.12 Yield kg ha-1 3000 2000 1000 0 0 0.2 0.4 0.6 0.8 1 0 0.2 0.4 0.6 0.8 1 NDVI NDVI
Feekes10.5 6000 5000 2 y = 5379.6x - 2310.5x + 1504.5 2 R = 0.5943 4000 Yield kg ha-1 3000 2000 1000 0 0 0.1 0.2 0.3 0.4 0.5 0.6 0.7 0.8 0.9 1 NDVI
Feekes 10.5 R.I.<1.5 R.I.>1.5 6000 6000 5000 5000 2 y = 2344x + 1844.5x + 270.99 2 R = 0.23 2 4000 y = 2188x 4000 + 1336.7x + 708.19 2 R = 0.72 Yield kg ha-1 3000 3000 2000 2000 1000 1000 0 0 0 0.2 0.4 0.6 0.8 1 0 0.2 0.4 0.6 0.8 1 NDVI NDVI
NDVIand INSEY vs. Yield, Feekes 10.5 6000 6000 5000 5000 1.815x y = 700.86e 365.08x y = 696.59e 2 R = 0.6039 2 R = 0.6009 4000 4000 Yield kg ha-1 3000 3000 2000 2000 1000 1000 0 0 0 0.1 0.2 0.3 0.4 0.5 0.6 0.7 0.8 0.9 1 0 0.0005 0.001 0.0015 0.002 0.0025 0.003 0.0035 0.004 0.0045 0.005 NDVI INSEY
Response Indices Feekes 9 4 2 y = -0.0403x + 1.1861x - 0.0877 3.5 R 2 = 0.98 3 • Strong correlation between ISRI and RI determined at harvest • Accurately predict the crop’s ability to respond to N • RI can refine whether or not N should be applied, how much, and expected NUE 2.5 RI 2 1.5 1 0.5 0 0 0.5 1 1.5 2 2.5 3 3.5 4 ISRI Feekes 10.5 2 4 + 1.5816x - 0.4018 y = -0.1467x 3.5 2 R = 0.93 3 2.5 RI 2 1.5 1 0.5 0 0 1 2 3 4 5 ISRI
Conclusion • Grain yield was highly correlated with NDVI and INSEY • Grain yield could be accurately predicted using NDVI readings at Feekes growth stages 9 and 10.5 • ISRI can accurately predict response to N • NDVI readings (Feekes 9 and 10.5) at locations with high RI (>1.5) showed higher correlation with grain yield than those with low RI (<1.5)