Download
1 / 35
350 likes | 473 Views
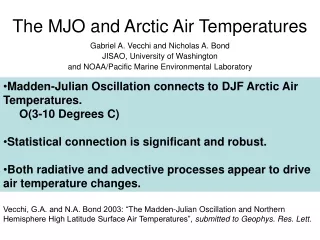
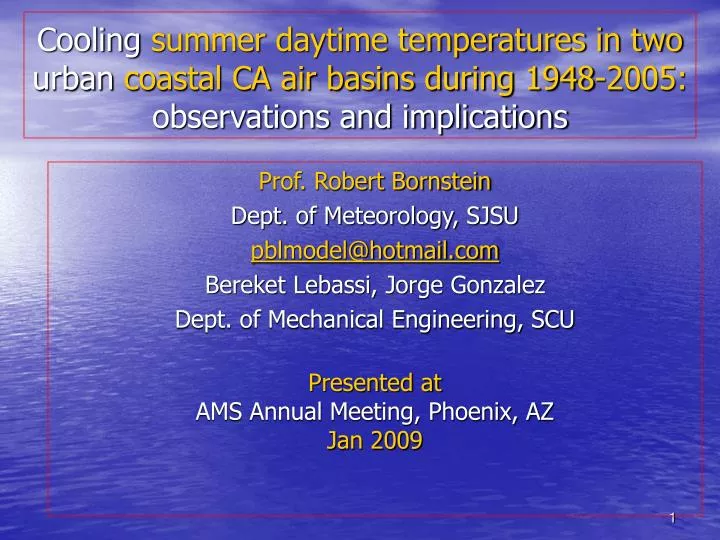
Cooling summer daytime temperatures in two urban coastal CA air basins during 1948-2005: observations and implications. Prof. Robert Bornstein Dept. of Meteorology, SJSU pblmodel@hotmail.com Bereket Lebassi, Jorge Gonzalez Dept. of Mechanical Engineering, SCU Presented at

E N D
Cooling summer daytime temperatures in two urban coastal CA air basins during 1948-2005: observations and implications Prof. Robert Bornstein Dept. of Meteorology, SJSU pblmodel@hotmail.com Bereket Lebassi, Jorge Gonzalez Dept. of Mechanical Engineering, SCU Presented at AMS Annual Meeting, Phoenix, AZ Jan 2009
ACKNOWLEDGMENTS FUNDING PROVIDED BY: • SANTA CLARA UNIVERSITY • NSF • USAID
OVERVIEW • BACKGROUND • DATA • ANALYSES • RESULTS • ALL OF CALIFORNIA • COASTAL VS. INLAND • UHI IMPACTS • IMPLICATIONS • FUTURE EFFORTS to appear, J. of Climate as Lebassi et al. (2009)
“The” research-problem • What are the impacts of global climate change on CA • climate, e.g., seasonal and daily temperature trends • weather, e.g., precipitation and water supply • air quality, e.g., ozone and PM • energy planning, e.g., for peak usage • human health, e.g., UHI and thermal stress levels • agriculture, e.g., winery operations • (Not covered in this paper) How can meso-met modeling best be used to • reproduce past changes • estimate future trends
Background (1 of 2) • Global scale observations generallyshow past asymmetric (more for Tmin than for Tmax) warming accelerated since mid-1970s on • global scale (1.0-2.5 deg resolution) (see graph) • regional scales • Global-model results • match the observations • predict accelerated further warming • CA downscaled global-model results (see 2nd graph) • have been done (at SCU & elsewhere) onto 10 km grids • show summer warming that decreases towards coast (but no cooling)
Not much change from mid- 40s to mid-70s, when values started to again rapidly rise
Statistically down-scaled (Prof. Maurer, SCU) 1950-2000 Summer (JJA) IPCC temp-changes (0C) show warming rates that decrease towards coast; red dots are COOP sites used in present study & boxes are study sub-areas
Background (2 of 2): Previous CA studies (next 2 slides) have explained their climate-change obs in terms of increased GHGs & increased: • Coastal upwelling:Bakum (1990) • SSTs & urbanization: Goodridge (1991) • Cloud cover:Nemani et al. (2001) • UHIs: Duffy et al. (2006) • Irrigation • Christy et al. (2006) • Bonfils and Lobell (2007) • Lobell and Bonfils (2008)
Current Hypothesis INCREASED GHG-INDUCED INLAND TEMPS INCREASED (COAST TO INLAND) PRESSURE & TEMP GRADIENTS INCREASED SEA BREEZE FREQ, INTENSITY, PENETRATION, &/OR DURATION COASTAL AREAS SHOULD SHOW COOLING SUMMER DAYTIME MAX TEMPS (i.e., A REVERSE REACTION) NOTE: NOT A TOTALLY ORIGINAL IDEA
CURRENT DATA • NCDC DAILY MAX & MIN 2-METER TEMPS • FROM ABOUT 300 CA NWS COOP SITES • FOR 1948-2005 • USED IN MANY OTHER CA CLIMATE-CHANGE STUDIES • ERA40 1.4 DEG T-85 REANALYSIS SUMMER (JJA) 1000-LST • SEA-LEVEL PRESSURE TRENDS • FOR 1970-2005
DATA ANALYSES • Emphasis: on summer (JJA) data from 1970-2005 • All-CA warming/cooling trendscalculated (0C/decade) for: Tmax, Tmin, Tave, & daily temp range (DTR = Tmax -Tmin) • Spatial-distributions of Tmax trends: plotted for the • South Coast Air Basin (SoCAB) • SFBA (includes northern Central Valley) • Tests of statistical significance • Land-sea sea-level pressures • Spatial-distributions of 1979-2005 trends • Temporal-trends for sea-level pressure-gradient
Results 1: SoCAB 1970-2005 summer (JJA) Tmax warming/ cooling trends (0C/decade); ?=more data neededsolid, crossed, & open circles show stat p-values < 0.01, 0.05, & not significant, respectively ? ? ?
Results 2: SFBA & Central Valley 1970-2005 JJA Tmax warming/cooling trends (0C/decade), as in previous figure ? ? ?
GOES10 image of summertime marine Stratus penetration into Central Valley: supports our inland coastal cooling boundary (Leoncini, 2002)
Results 3: JJA Temp trends; all CA-sites • LOWER TRENDS FROM 1950- 70 (EXCEPT FOR TMAX) • Curve b: TMIN HAD FASTEST RISE (AS EXPECTED) • Curve c: TMAX HAD SLOWEST RISE; IT IS A SMALL-∆ b/t BIG POS VALUE & BIG NEG-VALUE (IN LAST 2 GRAPHS) • CURVE a:TAVE THUS ROSE AT MID RATE • Curve d: DTR (diurnal temp range) THUS • DECREASED (AS TMAXFALLS & TMIN RISES) A B C D
Significance of these all-CA Trends • HIGHER TRENDS FROM 1970-2005 FOCUS NEEDED ON THIS PERIOD • TMINHAS FASTER RISE ASSYMETRIC WARMING IN LITERATURE • BUT TMAX • HAS SLOWER RISE • IT IS A SMALL DIFFERENCE B/T BIG POS-VALUE & BIG NEG-VALUE (AS SEEN IN ABOVE SPATIAL PLOTS) • TAVE & DTR ARE ALSO THUS “CONTAMINATED” • NEXT 2 SLIDES THUS SHOWS SEPARATE TRENDS FOR CALIFORNIA • COASTAL AREAS • INLAND AREAS
Result 4: JJA Tave, Tmin, Tmax, & DTR TRENDS FOR INLAND-WARMING SITES OF SoCAB & SFBA a • Curve b: TMIN IN-CREASED (EXPECT-ED) • Curve c: TMAXFASTER RISE (UNEXPECTED), COULD BE DUE TO INCREASED >UHIs • DOWN-SLOPE FLOW • CURVE a:TAVETHUS ROSE AT MID RATE • Curve d: DTR THUS INCREASED, AS TMAX ROSE FASTER THAN TMIN ROSE b c d
Result 5: JJA Tave, Tmin, Tmax, & DTR TRENDS FOR COASTAL-COOLING SITES OF SoCAB & SFBA a • Curve b: TMINROSE (EXPECTED) • Curve c: TMAX COOLING (UNEXPECTED MAJOR RESULT OF STUDY) • CURVE a:TAVE THUS SHOWED ALMOST NO CHANGE • AS FOUND IN LIT • AS RISING Tmin & FALLING Tmax ALMOST CANCELLED OUT • Curve d: DTR THUS DE-CREASED, AS • TMIN ROSE & • TMAX FELL b c d
Trend in 1979-2002 ERA40 reanalysis of 1800 UTC (1000 LT) JJA sea-level p-changes (hPa/decade) • dots =1.4-deg grids • end-pts of solid lines = pts for p-grad trend calcu-lation (next slide) • H & L: both strengthened & moved to NW (can’t see here)
Result 6: Trends in sea minus land JJA 1800 UTC sea-level p- gradient (hPa/100-km/decade) from values at ends of lines in previous Fig. These stronger HPGFs stronger sea breezes coastal cooling
IPCC 2001 does show cooling over Central California!!
Significance of above Coastal-Cooling and Inland-Warming trends • CA ASSYMETRIC WARMING IN LITERATURE IS HEREIN SHOWN TO BE DUE TO • COOLING TMAX IN COASTAL AREAS & • CONCURRENT WARMING TMAX IN INLAND AREAS • PREVIOUS CA STUDIES • DID NOT LOOK SPECIFICALLY AT SUMMER DAYTIME COASTAL VS. INLAND VALUES HAVE • THEY THUS REPORTED CONTAMINATED TMAX, TAVE, & DTR VALUES • THEY, HOWEVER, ARE NOT INCONSISTENT WITH CURRENT RESULTS, THEY ARE JUST NOT AS DETAILED IN THEIR ANALYSES & RESULTS
Result 7. JJA 1970-2005 2 m Tmax trends for 4 pairs of sites:urban (red, solid) & rural (blue, dashed) r • Notes: • All sites are near • cooling-warming border • UHI-TREND(K/decade) • = absolute sum b/t warming-urban & • cooling-rural trends • a. SFBA sites • > Stockton • (0.38 + 0.17 = 0.55) • > Sac. (0.49) • b. SoCAB sites • > Pasadena (0.26) • > S. Ana (0.12) u
Notes on JJA daytime UHI-trend results • Faster growing cities (area & population) had faster growing UHIs (not shown) • As no coastal sites showed warming Tmax values, calculations could only be done at • these four pairs • Located at the inland boundary of the warming and cooling areas • Coastal sites would have cooled even more without their (assumed) growing UHIs
SUMMARY OF CURRENT CA OBS • SUMMER Tmin IN CALIF HAVE BEEN WARMING FASTER THAN Tmax • SUMMER DAYTIME Tmax HAVE BEEN COOLING, IN LOW-ELEVATION COASTAL AIR-BASINS • THE FOLLOWING AREAS ARE COOLING IN CENTRAL CA: • MARINE LOWLANDS • MONTEREY • SANTA CLARA VALLEY • LIVERMORE VALLEY • WESTERN HALF OF SACRAMENTO VALLEY
Current results are unique, as this study is first to: • segment obs in all the following ways • summer-values only • Tmax & Tmin, as well as Tave • coastal vs. inland sites • consider sea-breeze enhancement • as causal mechanism of climate change • instead of: GHGs, irrigation, SST, UHI, PDO, &/or aerosols (next slide) • do data analyses & urbanized meso-met modeling (not shown)
Possible explanations of coastal cooling in the literature • GHGwarming: • triggers secondary “reverse reaction” local effects • e.g., increased sea breeze activity (our contention) • UHI development: warms (& not cools) • SST changes: • GHG warming off Calif.-coast is stronger than increased upwelling, as • SSTs are increasing (not shown) • PDO: uncorrelated to Tmax (not shown) • Increased rural-irrigation: • cools Tmax • important in Central Valley
BENEFICIAL IMPLICATIONS OF COASTAL COOLING • NAPA WINE AREAS • MAY NOT GO EXTINCT • REALLY GOOD NEWS!(next map) • ENERGYFOR COOLING • MAY NOT INCREASE AS RAPIDLY AS POPULATION • PAPER J21.4, THIS SESSION BY GONZALEZZ ET AL. • LOWER HUMAN HEAT-STRESS RATES • O3 CONCENTRATIONSMIGHT CONTINUE TO DECREASE, AS LOWER Tmax REDUCES • ANTHROPOGENIC EMISSIONS • BIOGENIC EMISSIONS • PHOTOLYSIS RATES
NAPA WINE AREAS MAY NOT GO EXTINCT DUE TO ALLEGED RISING TMAX VALUES, AS PREDICTED IN NAS STUDY
GOOD IMPLICATIONS FOR O3 • PAST & PROJECTED SFBA & SoCAB O3 DECREASES MAY • IN-PART BE DUE TO DAYTIME TmaxCOOLING- TRENDS and • NOT ONLY TOREDUCED ANTHROPOGENIC EMISSIONS • RECENT CARB AQMSs • HAVE NOT REPRODUCED FULL RATE OF OBSERVED O3-DECREASE • MAYBE (IN PART) DUE TO THIS UNMODELED COOLING TREND
Future Coastal-Cooling Efforts(PART 1 OF 2) • EXPAND (TO ALL OF CA & beyond) • ANALYSIS OFOBS (IN-SITU & GIS) • URBANIZED MESO-MET (MM5, RAMS, WRF) MODELING • SEPARATE INFLUENCES OF CHANGING (via uRAMS modeling in SCU PhD of B. Lebassi): • LAND-USE PATTERNS • AGRICULTURAL IRRIGATION • URBANIZATION • SEA BREEZE: INTENSITY, FREQ, DURATION, &/OR PENETRATION
POSSIBLE FUTURE EFFORTS (PART 2 OF 2) • DETERMINE POSSIBLE “SATURATION” OF SEA- BREEZE EFFECTS FROM • COLD-AIR TRANSPORT • STRATUS-CLOUD EFFECTS ON LONG- & SHORT-WAVE RADIATION • DETERMINE CUMULATIVE FREQ DISTRIBUTIONS OF TMAX VALUES, AS • EVEN IF AVERAGE TMAX DECREASES, • EXTREME VALUES TMAX MAY STILL INCREASE (IN INTENSITY &/OR FREQUENCY) • DETERMINE CHANGES IN LARGE-SCALE ATM FLOWS: • HOW DO GLOBAL CLIMATE-CHANGE EFFECT POSITION & STRENGTH OF: PACIFIC HIGH & THERMAL LOW? • THESE TYPES OF CLIMATE-CHANGES ARE THE ULTIMATE CAUSES OF LOCAL TEMP & PRECIP CHANGES
Cooling summer daytime temperatures in two urban coastal CA air basins during 1948-2005: observations and implications Prof. Robert Bornstein Dept. of Meteorology, SJSU pblmodel@hotmail.com Bereket Lebassi, Jorge Gonzalez Dept. of Mechanical Engineering, SCU QUESTIONS?