Download
1 / 22
220 likes | 482 Views
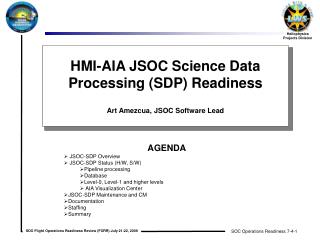
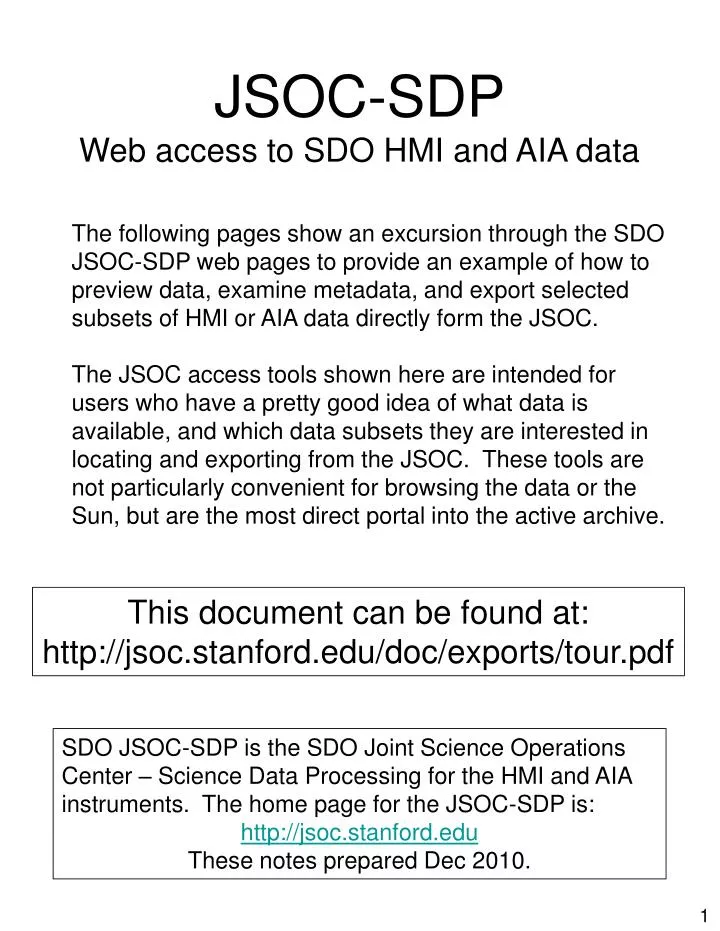
JSOC-SDP Web access to SDO HMI and AIA data. The following pages show an excursion through the SDO JSOC-SDP web pages to provide an example of how to preview data, examine metadata, and export selected subsets of HMI or AIA data directly form the JSOC.

E N D
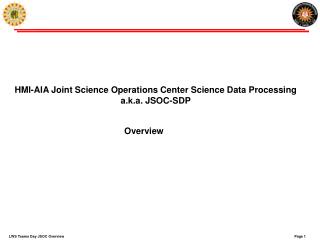
JSOC-SDPWeb access to SDO HMI and AIA data The following pages show an excursion through the SDO JSOC-SDP web pages to provide an example of how to preview data, examine metadata, and export selected subsets of HMI or AIA data directly form the JSOC. The JSOC access tools shown here are intended for users who have a pretty good idea of what data is available, and which data subsets they are interested in locating and exporting from the JSOC. These tools are not particularly convenient for browsing the data or the Sun, but are the most direct portal into the active archive. This document can be found at: http://jsoc.stanford.edu/doc/exports/tour.pdf SDO JSOC-SDP is the SDO Joint Science Operations Center – Science Data Processing for the HMI and AIA instruments. The home page for the JSOC-SDP is: http://jsoc.stanford.edu These notes prepared Dec 2010.
http://jsoc.stanford.edu – Serves as primary entry point into SDO/HMI and SDO/AIA data access via the JSOC-SDP. Explore all the links. Comments are welcome. The next pages start with a “click” on the lookdata link shown by the arrow.
http://jsoc.stanford.edu/ajax/loookdata.html is entry to explore and preview the holdings at the JSOC. The first step is to select the dataseries you need. This interface assumes that you already understand the types of data obtained by SDO HMI and AIA and have an idea of what you need. For this example some HMI data will be selected. The series filter chosen is hmi.*45s which finds the 45-second cadence HMI science level data. The series hmi.M_45s is chosen.
The act of selecting a dataseries causes a jump to the RecordSet tab where you can specify a subset of the series to either examine metadata or to export. The series content is summarized at the top and a link is provided to additional notes. You can select keywords or data segments (i.e. files) here for immediate inspection. Note the various checkboxes to tailor the page to your needs.
The key information needed from the user here is the specification of “prime key” values that will limit the selected record set to only the desired range of, usually, time. The RecordSet specifier is actually a query into the DRMS database. Shortcuts are available for the prime-keys which are the keywords used to identify unique records. For instance the query above will select 20 minutes beginning at 13:20 on 2 October 2010. For HMI TAI is preferred vs UTC since the data is computed on “nice” TAI ticks. The example uses the default UTC however.
The “Series Content” tab lists the available metadata keyword names, names and structure of data segments, and any DRMS links to other dataseries from this series.
The “Values Display” tab shows the selected metadata names and values in a scrollable table. You can sort the rows by clicking on a column name. You can change column widths by dragging the “|” in the title row. If you want to copy/paste the metadata to other applications, explore the available “psuedo-keywords” with names like “*recdir* and the checkboxes on the RecordSet Select” tab
The Values Display can be restricted to the keywords of interest for data preview. The “QUALITY” keyword should be present is all dataseries and is useful for judging the usefulness of any given datarecord. QUALITY=0 means nothing known to be wrong. Note that the paths to the data files are relative to http://jsoc.stanford.edu.
The “Test” tab reveals a graphing capability still being developed. The keywords shown will be the same as selected on the RecordSet Select section. Click on a keyword, then click on popup box to add a keyword to the graph. When all desired keywords have been selected, click on the Create Graph button. See http://www.amcharts.com/ for usage information. There are still problems with the lookdata implementation as of Dec 2010.
The links from the “Values Table” tab point right into the DRMS archive to give you the Fitsio compressed, DRMS “as-is” fits file. Set your browser to recognize fits as a mime type and you can preview the data. See also http://heasarc.gsfc.nasa.gov/fitsio/ Note for HMI that this raw data will need a 180 degree rotation as indicated by the CROTA2 WCS keyword. Also note that HMI level1.5 data is not cropped but the off-disk pixels can be easily identified from: sqrt((x-CRPIX1)^2 + (y-CRPIX2)^2) > RSUN_OBS/CDELT1
The “Export” tab contains a link to the ajax/exportdata.html page where an actual data export request may be submitted. The current RecordSet specification will be forwarded to the export page and a new page or browser tab will be made for the export process. NOTE: in some browsers the jump to the export page/tab only happens if there is not already an export page/tab in the current browser instance. In those cases, simply select that page/tab.
This is the jsoc.stanford.edu/ajax/exportdata.html as entered from lookdata. The “Method” field allows the user to select how to receive the data. “url_quick” is used to access the data as-is with no fully populated FITS headers and in fitsio compressed FITS files via links directly into the JSOC archive. This is always the fastest way to preview a few images but may not provide convenient access for large requests or when the metadata keywords are needed embedded into the files. Use the “Method” drop-down list to select any other method for more options.
url_quick immediate response with table of links to data. The Record column contains the DRMS record specifier and the Filename column contains the full path to the data.
Method “url” reveals more options, will result in request submission and subsequent user initiated status request to do the data fetch.
A click on “?” provides help box for each field in the form. The Filename Format field allows the user to specify filenames of the exported data from explicit text and keyword values.
Upon submission of request the “Submit” button changes to the “Request Export Status” button and the RequestID is returned. This ID is used to fetch the result of the request.
The Status Request button on the export page, top part, gives the “packing list” of the export, but the actual fetch is accomplished by the button on the lower section of the page.
Be patient. An immediate status request is likely to get a message indicating the JSOC export system has not yet begun to process the request. But read these messages carefully, they may also indicate a problem with the request.
The Status Request button on the lower panel on the exportdata page provides links to fetch the data and a listing of the “packing list” which maps JSOC Record Specifiers to export file names.
The Processing options allow on-export processing such as extraction of a rectangular patch tracked at the Carrington rate. Here a region at 53W21N at 2010.10.02_00:00 is extracted in a 400x300 pixel box. If the time range were not given in the query or via the T_START and T_STOP fields a full disk passage would be extracted and exported. You may select from several options for box location and size units.
This sample cutout was made by the previous example, it is a 300x400 pixel cutout of a region that was at 53W21N at 2010.10.02_00:00. The data was HMI line-of-sight magnetograms.
The same cutout, but for HMI Continuum proxy. This is the same spot seen at the NW portion of the full disk magnetogram on page 10.