Download
1 / 46
460 likes | 563 Views
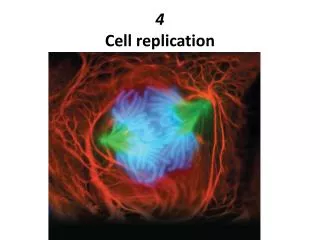
Cell Replication. Replication One double-strand DNA to two identical double-strand DNA ’ s One mother strand is in each of two daughter DNA ’ s (semi-conservative replication). Replication step 1. Separate the two DNA strands At origin of replication. Replication step 2.

E N D
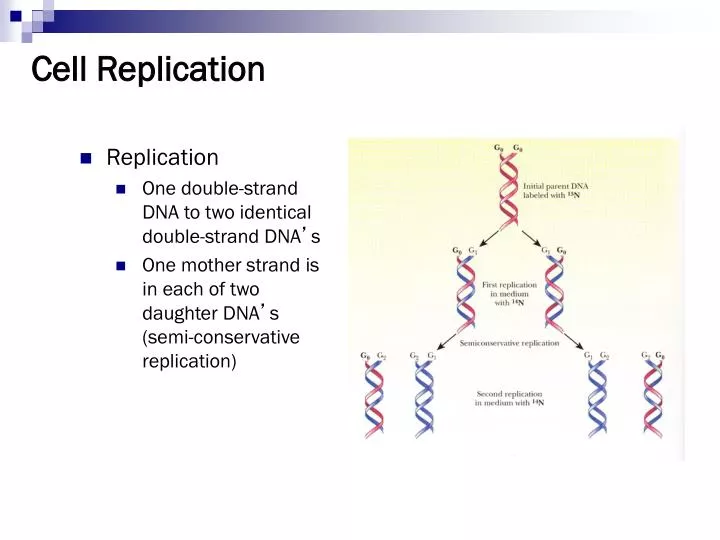
Cell Replication • Replication • One double-strand DNA to two identical double-strand DNA’s • One mother strand is in each of two daughter DNA’s (semi-conservative replication)
Replication step 1 • Separate the two DNA strands • At origin of replication
Replication step 2 • Synthesize DNA from 5’ to 3’ end and at the same time 3’ to 5’ end • DNA polymerase catalyzes only in 5’ to 3’ direction in new chains • Original 3’-5’ (leading) strand continues replicating • Original 5’-3’ (lagging) strand replicate semi-discontiously at every 1000-2000 bp (Ozaki fragment)
Replication step 3 • Proofread and repair • detect mutation, once in 104 to 105 bases • Mismatch repair in E.Coli • Newly synthesized DNA (red) • has a mismatch (G-T). • (b) MutH, MutS, and MutL link the • mismatch with the nearest • methylation site (blue) • (c) An exonuclease removes from • red strand • (d) DNA polymerases replace it
How to find the origination/termination site ? • Chargaff parity rules (CPR) -1951 • # of A = # of T; # of C = # of G • CPR I – double strands of DNAs • Obvious from complementary relationship • CPR II – single strand of DNA • Cause is not known yet • Violation is called ‘skew’ • GC skew: (G-C)/(G+C)
GC skew • Max or min of GC skew appears at ori or ter sites
Oligomer skew • fi : # of oligomer i in a segment • OAi= ln(fi/fi’)
Evolution • Charles Darwin, 1859 • Natural selection • Evolution • Change in frequency of genes in a population • Heritable changes in a population over many generations • Process of mutation with selection • Two essential factors that define evolution • Error-prone self-replication • Variation in success at self-replication
Error-prone Self-replication • Self-replication • Whatever is evolving must have the ability to make copies of itself • Typical developments, aging etc., are not evolution • Genes can self-replicate in the context of cells that they reside in • “replicator” can self-replicate • Asexual organisms like bacteria can self-replicate • Sexual organisms can replicate, but inheriting from parents • Darwin focused on genes rather than organisms as the fundamental replicators • Error-prone • Copies are not always identical to the originals • Perfect copies will not foster evolution • In fact, current genes are from gradual changes from previous versions with slight errors • Errors are essential for evolution, provided they occur not too frequently
Variation • Self-replication • Most organisms can increase exponentially • If all organisms survived and multiplied at the same rate, there will be no change in frequency of the variants, and thus no evolution • Limited by food, space, predators, etc. • When population size is limited, not all variants survive • A possibility of natural selection • Also, chance effects exist • Equal-sized populations with two variants will not stay the same even with the same degree of fitness • Called random drift, the chance effect will take over the whole population • This implies that evolution can occur even without natural selection, referred to as neutral evolution
Mutation • Any change in a gene sequence that is passed on to offspring • Caused by • A damage to DNA moledule (from radiation, etc.) • Errors in replication • Point mutation – simplest form of mutation and occurs all over DNA sequences • Transition – mutation within purine (A,G) or pyrimidine (C,T/U) • Transversion – mutation between nt groups • Effects depend on where mutations occur • Non-coding region – no effect on proteins, and neutral • But may have significant effects if occurring in control region • Coding region • Synonymous substitution when a mutation does not change AA • Non-synonymous • AA is replaced by another • stop codon is introduced
Models of nucleotide substitution transition A G transversion transversion T C transition
Indel mutation • Small indels of a single base of a few bases are frequent • Caused by slippage during DNA replication • Particularly frequent with repeated sequences • GCGC…: insertion of extra GC or deletion cause slight slippage • CAG repeated region in huntingtin protein can expand, causing Huntington’s disease • Indels can cause frame shift, if indels are not multiples of three • Gene inversion • Whole genes are copied to offspring in reverse direction • Translocation • Whole genes can be deleted from one genome and inserted into another
Mutation Example • BRCA1 protein • Normal role is to repair oxidative DNA damage, and damages accumulate if not functions • 24 exons • Human Gene Mutation Database • About 400 mutations • 1/3 are single nt substitutions (SNPs) • 1/3 are small deletions • Alternative splice site is lost due to mutation
Globin • Golbins are first proteins to be sequenced • Hemoglobins • Myoglobin
Myoglobin • Tetrameric hemoglobin • Beta globin subunit • Myoglobin & beta globin
Orthologs: members of a gene (protein) family in various organisms. This tree shows globin orthologs.
Paralogs: members of a gene (protein) family within a species. This tree shows human globin paralogs.
Mature insulin consists of an A chain and B chain heterodimer connected by disulphide bridges The signal peptide and C peptide are cleaved, and their sequences display fewer functional constraints.
Note the sequence divergence in the disulfide loop region of the A chain
Historical background: insulin • By the 1950s, it became clear that amino acid substitutions occur nonrandomly. • For example, Sanger and colleagues noted that most amino acid changes in the insulin A chain are restricted to a disulfide loop region. • Such differences are called “neutral” changes (Kimura, 1968; Jukes and Cantor, 1969) • Subsequent studies at the DNA level showed that rate of nucleotide (and of amino acid) substitution is about six-to ten-fold higher in the C peptide, relative to the A and B chains.
0.1 x 10⁻⁹ 1 x 10⁻⁹ 0.1 x 10⁻⁹ Number of nucleotide substitutions/site/year
Historical background: insulin Surprisingly, insulin from the guinea pig (and from the related coypu) evolve seven times faster than insulin from other species. Why? The answer is that guinea pig and coypu insulin do not bind two zinc ions, while insulin molecules from most other species do. There was a relaxation on the structural constraints of these molecules, and so the genes diverged rapidly.
Guinea pig and coypu insulin have undergone an extremely rapid rate of evolutionary change Arrows indicate positions at which guinea pig insulin (A chain and B chain) differs from both human and mouse
Population Genetics • Genealogical Tree • Evolution tree of a gene without recombination (mtDNA, chromosome) • Given the current generation, can trace back to a single copy of the gene – coalescence process • Example • Human mtDNA is traced back to African woman 200,000 years ago (1996)
Coalescence • Mitochondrial Eve • Used highly variable non-coding part, called D-loop • The average # of site with difference: 61.1 out of 16,553 bases • The average pairwise difference is 76.7 between Africans, and 38.5 between non-Africans • There have been different divergent population in Africa for much longer • Relatively small population left African and spread through the rest of the world • The earliest branch point – 170,000 ± 50,000 • Non-African migration – 52,000 ± 27,000
Orange/Green – all Africans Yellow/blue – non-Africans
Coalescence Model • Assumptions • Constant population of N throughout time • Each individual is equally fit (same expected number of offspring) – equally likely to have any of the individuals in the previous generation as mother • Pick two indiividuals in the present generation • Prob. of having the same mother = 1/N • Prob. that their most recent common ancestor lived T generations ago • P(T) = (1 - 1/N)T-1 (1/N) ≈ e-T/N/ N • Coalescence of the lines of descent of any two individuals is exponentially distributed with the mean time until coalescence of N generations
Fixation in Neutral Model • Mutation 1 does not survive to the present generation • Mutation 2 has a chance to spread to the entire population (fixed) • Most mutation die out • If a mutation is neutral, the prob. of becoming fixed, Pfix ? • Assume N copies of a gene and that each one is equally likely to mutate • Prob. that mutation occurred in the gene copy of an ancestor of the present generation is 1/N = pfix • New mutation takes place with the prob. of u • Rate of new fixation of new mutations is the rate at which mutations occur, multiplied by the prob. that each mutation is fixed: • ufix = (Nu)*pfix = u • Shows that the rate of fixation of neutral mutations is equal to the underlying mutation rate and is independent of the population size
Fixation and Random Drift • Number of mutation in the population changes on a random basis • If m copies of a neutral mutant sequence at one generation, • The number of copies at the next generation, n ≈ m • Wright-Fisher model • Each copy of the gene in the next generation is randomly selected from genes in the previous generation • Mutation prob. a = m/N, prob. of no mutation = 1-a • Prob. of n mutations in the next generation, p(n) = CNnan(1-a)N-n • The mean value: Na = m • Simulation with N=200 with 2,000 generations
Fixation with Selection • Advantageous mutation with a fitness 1 + s • s: selection coefficient • If m copies of the mutation, the mean fitness of the population: E[W] =[m(s+1) + (N-m)]/N • Wright-Fisher model • Gene copy is selected for the next generation with a prob. proportional to its fitness • a = m(1+s)/NE[W] • The number of copies in the next generation is still by binomial • Exact analysis by diffusion model
Molecular clock hypothesis In the 1960s, sequence data were accumulated for small, abundant proteins such as globins, cytochromes c, and fibrinopeptides. Some proteins appeared to evolve slowly, while others evolved rapidly. Linus Pauling, Emanuel Margoliash and others proposed the hypothesis of a molecular clock: For every given protein, the rate of molecular evolution is approximately constant in all evolutionary lineages
Dickerson (1971) corrected amino acid changes per 100 residues (m) Millions of years since divergence
Molecular clock hypothesis: implications If protein sequences evolve at constant rates, they can be used to estimate the times that sequences diverged. This is analogous to dating geological specimens by radioactive decay.
2 A F 1 1 G B 2 I H 2 C 1 D 6 E time Molecular phylogeny uses trees to depict evolutionary relationships among organisms. These trees are based upon DNA and protein sequence data. A 2 1 1 B 2 C 2 2 1 D 6 one unit E
2 A F 1 1 G B 2 I H 2 C 1 D 6 E time Tree nomenclature taxon taxon A 2 1 1 B 2 C 2 2 1 D 6 one unit E
Tree nomenclature: clades Clade ABF (monophyletic group) A 2 F 1 1 B G 2 I H 2 C 1 D 6 E time
Examples of clades Lindblad-Toh et al., Nature 438: 803 (2005), fig. 10
Phylogenetic Methods • Family of related sequences evolved from a common ancestor is studied with phylogenetic trees showing the order of evolution • Want to have a tree representation showing • Divergence among species • Evolutionary distance • Usually unrooted B C A D B D C B D A C A
Phylogenetic Trees • Rooted tree provide direction of evolution and its distance • Unrooted tree is less informative • Finding a root • Use known species relationship • If not known, use mid-point method: finding a point on the tree with the mean distance among the tree is identical in either side – assumes the same evolution rate
Tree Construction • Multiple sequences are aligned • Use JC or other models to compute pair-wise evolutionary distances • From distance matrix, use a clustering method • Join the closest two clusters to form a larger one • Recompute distances between all clusters • Repeat two steps above until all species are connected