Download
1 / 52
520 likes | 635 Views
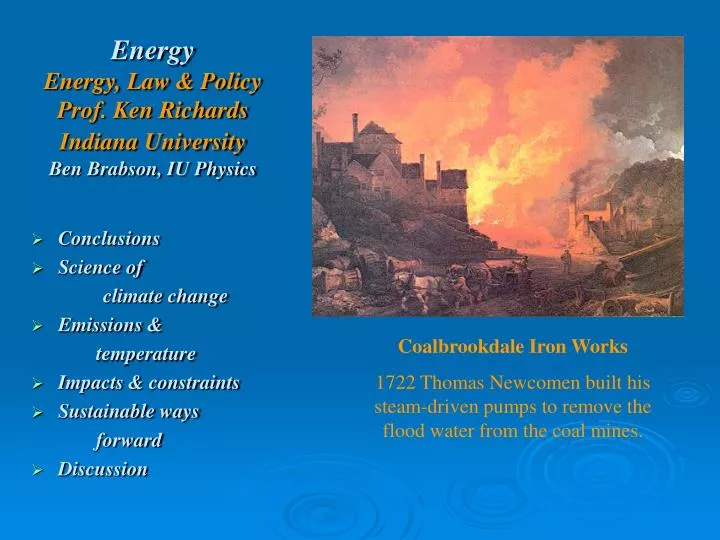
Energy Energy, Law & Policy Prof. Ken Richards Indiana University Ben Brabson, IU Physics. Conclusions Science of climate change Emissions & temperature Impacts & constraints Sustainable ways forward Discussion. Coalbrookdale Iron Works

E N D
EnergyEnergy, Law & Policy Prof. Ken RichardsIndiana UniversityBen Brabson, IU Physics • Conclusions • Science of climate change • Emissions & temperature • Impacts & constraints • Sustainable ways forward • Discussion Coalbrookdale Iron Works 1722 Thomas Newcomen built his steam-driven pumps to remove the flood water from the coal mines.
My Conclusion • That we are obliged to move away from our own non-sustainable and climate-damaging fossil fuel use as quickly as possible. (BBB – 9/3/08) “If not for the greenhouse effect, we may have been able to postpone (the decision to look beyond fossil fuels) to the 22nd century, because there are massive coal reserves available, and coal can be made into synthetic fuels. We could have developed the world economy based on fossil fuels …. But with the greenhouse effect, we have to make the transition much earlier, perhaps in the early 21st century. That means that we have to look very seriously at the alternatives.” Martin Hoffert, Professor, New York University
Greenhouse Effect* Two transparent windows: • Solar radiation – visible (0.3-0.8 mm) • Earth radiation – infrared (7-15 mm) Major infrared absorbers: • CH4, • N2O, • O3, • CO2, • H2O CH4 N2O O2,O3 CO2 H2O * Piexoto & Oort
Feedback in Climate T T Positive feedback example: A warmer surface temperature reduces the size of the highly reflective polar ice fields. The less reflective soil or open ocean absorbs more solar radiation increasing the surface temperature even further. Negative feedback example: T T A warmer surface temperature evaporates additional water forming more cloud. The cloud layer reflects incoming solar energy, reducing the surface temperature. Climate Models
Last 1000 years of CO2 385 ppm 280 ppm
Reserves: Reserves are fuels that have already been discovered, their quantity measured, and they are known to be extractable at competitive prices. Resources: Resources include reserves and, in addition, deposits that are inferred or expected, for which recovery is anticipated to be technically and economically feasible. This is the quantity used to estimate fuel lifetimes.
Natural Gas from Shale (NYT 8/25/08) • 20 tcf/yr = US Consumption 2008 Estimate of economically recoverable natural gas from shale. • 125 tcf/yr = 0.13 Q [6 yrs] Maximum possible resource: • 842 tcf/yr = 0.87 Q [40 yrs]
Global WarmingPrediction L. David Roper Professor Emeritus of Physics Virginia Polytechnic Inst. & St. Univ. roperld@vt.edu http://arts.bev.net/RoperLDavid http://www.roperld.com/science/GlobalWarmingPrediction.htm Global Warming and Peak Oil may be the greatest challenges that humans have encountered in the last 10,000 years.
Verhulst Function for resources depletion. Q = amount already extracted + amount left to be extracted = total amount to be extracted n ≠ 1 allows asymmetry. Verhulst Function: An asymmetric peaked curve.
Oil discoveries will not allow higher average extraction. Peak Oil Skewed toward later times.
You can’t extract it if you have not discovered it! Areas under both curves are the same. That is, the amount discovered equals the amount extracted. discoveries extraction The areas under the two curves are the same: ~2x10¹² barrels.
You can’t extract it if you have not discovered it! Areas under both curves are the same. That is, the amount discovered equals the amount extracted. discoveries The areas under the two curves are the same: ~8x10¹⁵ cu. ft.
Peaks between 2060 & 2100 Double known coal. Unlikely! Known existent coal (EIA)
Factors and Assumptions Coal = 50% carbon, short ton = 0.907 tonnes Crude oil = 84% carbon, bbl = 0.136 tonnes Natural gas = 76% carbon, tcf = 0.0189 tonnes CO2 concentration in ppmv = 0.47 x gigatonnes carbon emitted (may increase with high concentration; i.e., may be nonlinear; see later) Climate sensitivity = 3°C for doubling CO2 25% of fossil fuels are used to make useful materials or are lost instead of being burned. Background year 1700 CO2 concentration = 280 ppmv
CO2 concentration due to Fossil-Fuels burning + background Below measured data, as it should be.
Assume carbon sequestration or a coal-burning moratorium. Probably optimistic!
Temperatures for some of the cases considered DoubleCoal Coal Moratorium or Carbon Sequestration Assumes that there is no triggering of Earth states.
!Some Nightmares! Suppose concentration/emissions factor changes with increasing concentration from 0.47 to 0.94 (land and ocean become saturated with CO2). Suppose permafrosted tundra release of carbon during the next century (example of temperature feedback). Suppose climate sensitivity changes from 3 to 4 over the next two centuries. (It is known that it changes to 6 over millennia because of slow feedbacks.)
David Roper’s Conclusions Peaking fossil fuels keeps CO2 concentration from going extremely high, unless it triggers other effects. Since temperature rise of about 0.8°C from 18th century is already causing disastrous events, the continuing increase of another 1°C or more will cause even more disasters and may other Earth changes that will cause a higher temperature. The peaking of fossil fuels may be as large immediate disaster as is global warming.
Global Surface Temperature to 2007 Looking at the northern hemisphere alone, 2007 temperatures averaged 15.04 degrees Celsius (59.1 degrees Fahrenheit)—easily the hottest year in the northern half of the globe since the record began in 1880, and more than a degree warmer than the 1951–80 average. Paleo-temperature records from ancient tree rings suggest that the northern hemisphere is now warmer than at any time in at least the last 1,200 years. [GISS] Goddard Institute for Space Studies (US) Climatic Research Unit & Hadley Centre (UK)
The Millennial Temperature RecordJones, et al – Climatic Research Unithttp://www.cru.uea.ac.uk/cru/info/milltemp/ • Different choices of Northern Hemisphere proxies (trees, ice cores, corals, lake & marine sediments, and historical documents) • Natural forcing from sun and volcanoes dominate the pre-1850 record and only human activities appear to adequately explain the rise in temperature during the 20th century.
Climate Change Summary • Snow pack in Himalaya, Rocky Mountains summer drought in downstream areas. [T] • Open Arctic water in summer absorbs far more solar energy than when ice-covered. [Positive feedback] • Ocean expansion (warming) and Greenland, Antarctica Northern Canada rapid melting rapid glacial flow Sea level rise [T] • Thresholds, when crossed, make rapid transitions: • Fresh water melting into the North Atlantic slows the Gulf Stream • Ocean surface temperature above 27oC increased hurricane severity.
Present impacts (measurements) Observational evidence from all continents and most oceans shows that many natural systems are being affected by regional climate changes, particularly temperature increases. Hydrological systems changes are occurring: a.) increased runoff and earlier spring peak discharge in many glacier- and snow-fed rivers, 2.) warming of lakes and rivers in many regions, with effects on thermal structure and water quality Marine and freshwater biological systems changes are associated with rising water temperatures, as well as related changes in ice cover, salinity, oxygen levels and circulation. An example: shifts in ranges and changes in algal, plankton and fish abundance in high-latitude oceans Future impacts (models) Drought-affected areas will likely increase in extent. Heavy precipitation events which are very likely to increase in frequency, will augment flood risk. In the course of the century water supplies stored in glaciers and snow cover are projected to decline, reducing water availability in regions supplied by melt water from major mountain ranges where more than one-sixth of the world population currently lives. Over the course of this century, net carbon uptake by terrestrial ecosystems is likely to peak before mid-century and then weaken or even reverse, thus amplifying climate change. Approximately 20-30% of plant and animal species assessed so far are likely to be at increased risk of extinction if increases in global average temperature exceed 1.5-2.5°C. IPCC Working Group II – Sensitivity & vulnerability of natural & human systems to climate change and potential consequences of climate change
Illinois Extreme Temperatures Springfield Tmin & Tmax HadCM3 - Northern Illinois HadCM3 - Central Illinois HadCM3 - Southern Illinois Winter Tmin Summer Tmax
GEV Analysis of Illinois Extreme Temperatures Unlike Britain, most of model movement during 21st century is in the mean, not in the width or tail! We will see that SM already low. Winter HadCM3 Tmin ~ OK Summer HadCM3 Tmax – Avg T ~OK BUT… Hot extremes too HOT!
So… What to do?
Martin Hoffert:If it were not for climate change, we would have had an additional 150 years to develop alternative energy sources. SUSTAINABILITY – “roughly, the ability to meet our needs without compromising the ability of future generations to meet theirs.” Brundtland Commission (1987) Depletion PresentOil/Gas/UNear TermClimate ChangeInnovationLong Term COAL COAL X CARBON SEQ. OIL X oil X GAS X gas X URANIUM X uranium BREEDERS TAR SANDS X SOLAR (P.V., Wind, OTEC, Biomass..) FUSION GAS CLATH. GEOTHERMAL
“Wedges” of U.S. Carbon DisplacementAm. Solar Energy Society’s “Tackling Climate Change in the U.S.” Conservation & Efficiency
Carbon Displacement by Region in Am. Solar Energy Society’s, “Tackling Climate Change”
Green Architecture: Green Building Resource Center [http://www.globalgreen.org] Robert Redford Bldg., Los Angeles Elizabeth Fry Building and Zicer Building at the University of East Anglia [http://www.uea.ac.uk] University of Alabama – Winter/Summer geothermal scheme MIT – Kresge Auditorium and Ice Skating Rink SPEA – Green roof, high e materials Habitat – Straw bale homes Recycling: Cradle to Cradle: Remaking the Way We Make Things, William McDonough & Michael Braungart Germany & Japan require that all autos, appliances, office equip. be designed to disassemble and recycle. NEC, Japanese electronics firm, clusters its factories: waste from one process is raw material for another. PNC Financial Services in Pittsburg recycled an entire building. Reducing Energy Use
MIT & Alabama • MIT’s Kresge Auditorium (1953) • Eero Saarinen’s 1200 tons of concrete shell resting on 3 points with no internal support, 1/8th of a sphere • And a new ice skating rink next door! • What happened next, do you suppose? • University of Alabama: StudentRecreational Center (1994) • Spanning Summer/Winter cycle! • Geothermal storage of summer heat under the campus for use the following winter. • Average ground temperature ~ 65 oF • Related ideas: • * Winter Ice for summer • * “Flywheel” (geothermal storage) • * Heat Pumps & AC
Carbon-neutralEnergies Biomass: • Ethanol from sugar cane • Biodiesel from soybeans, rape seed, jatropha curcas [T] • Ethanol from cellulose • Gasification to syngas [T] • Pellets from compressed biomass waste – [CHP - UEA] Geothermal storage: • Vertical/horiz. loop systems Solar: • passive, active, wind [T] • OTEC, waves, tides • Photovoltaics • Direct Solar – e.g. Spain • Direct – Stirling Engine ------>
Examples from: Dr. C. E. Sooriamoorthi Emeritus Professor Madurai Kamaraj University India c.e.soori@gmail.com
Bio Diesel • Oil from the plant Jatropha curcas aka “Physic Nut”
Main Distribution Regions http://www.jatropha.de/
Semi tropical plant that - yields fruit from 3rd year and lives for 60yrs - Needs little water, fertilizer, and care - Not foliage (cattle food) - Has seeds that yield 12 ton /year/ hectare - Has oil content 30% by weight - can be directly uses in trucks, railway engines - costs $.50/gallon Jatropha Curcas
HIGH Innovative Transport: Efficient Mass Transport: High-speed trains Magnetic levitation Automobiles: REVA – solar cars - 60 mi/ch Plug-in Hybrids (~80 mpg) Fuel cells (~60% efficient) Carbon, CO2 Sequestration: CO2 high pressure underground, ocean absorption, algal blooms, planting forests HIGHER Nuclear Reactors: Fast reactors w/ pyrometallurgical reprocessing – 238U and transuranics like 239Pu become usable fuels. (Sci.A. 12/05) Safer Light Water Reactors – pebble-bed reactors, AP-1000… Martin Hoffert’s List: Orbiting photovoltaics Superconducting grid wind/sol 32He fusion w/ moon mining Controlled fusion Methane Clatrates High-tech& Higher-tech Ideas
Coal Gasification I. Coal Gas: Destructive distillation (pyrolysis) “Coal Gas” + Coke. [Since bituminous coal has an atomic ratio, H/C ~ 0.6 and the energy content of carbon is 95 Kcal/mole and of hydrogen is 34 Kcal/mole, about 18% of coal’s energy comes from hydrogen.] II. Syngas: Heating coal with steam produces synthesis gas, (CO+H2). C + H20 CO + H2 III. IGCC: The Integrated Gasification Combined Cycle captures waste heat from the gasification, and burns the syngas to generate electricity first from a gas turbine, then a steam turbine. [Edwardsport, IN, & Tampa, FL., above] The CO2 can also be captured for sequestration [plans by Centrica and E.ON in UK]
Integrated Gasification Combined Cycle(IGCC) Clean Syngas Gas Turb. 180 MW Air Coal Steam Turb. 120 MW Water C + H2O CO + H2
Solar in Spain Direct Solar Acciona (Solargenix) - Nevada Photovoltaics Solucar (Abengoa) Solar Plant – Seville www.technologyreview.com/spain/solar/ Isofoton robot PV manufacture
Nuclear Energy Expensive (hard to make safe regulation) Limited economic fuel available (~oil) Proliferation of Pu-239 unsolved High-level waste disposal unsolved Catastrophic accidents have occurred 104 reactors 20% of US elec. CO2 produced similar to wind Generation III safer (Apr 2002 Physics Today) Fast reactors could use U-238
Example: “Developing wind projects in California – or anywhere,” Robert D. Castro, UCLA, Power 151, no. 12, Dec. 2007. A.) 28 states now have Renewable Portfolio Standards (RPSs) – 1.) California regulators have created RPSs for its 3 IOUs.* They must increase total annual retail power sales from renewables by > 1%/yr and attain 20% by 2010, and Schwarzenegger pushing for 33% by 2020. 2.) The US house passed a national RPS at 15% level by 2020, but still being debated in Senate. 3.) Wind is now mature, but often occurs in non-local settings. This introduces a regulatory approval process for transmission line companies. ($2M/mile) 4.) FERC (Federal Regulatory Commission) may be involved if state regulators refuse to approve new transmission. 5.) Wind rights and land-use rights, like mineral rights, have been sold to wind developers. 6.) Environmental review process can be long (Cape Wind is now ~12 years). The California Environmental Quality Act (CEQA) may require additional hearings, studies and documentation. 7.) Renewable Energy Credits (RECs) are valuable to the utility. 8.) Energy Policy Act (2005) provides a federal production tax credit (FTC) of 19cents/kWh until Dec 08. Rich new field for law!
Discussion on the end of cheap energy Thomas Homer-Dixon, Trudeau Center for Peace and Conflict Studies at U. Toronto, The End of Ingenuity, “Without doubt, mankind can find ways to push back constraints on global growth with market-driven innovation on energy supply, efficient use of energy and pollution cleanup. But we probably can’t push them back indefinitely, because our species’ capacity to innovate, and to deliver the fruits of that innovation when and where they’re needed, isn’t infinite. Sometimes even the best scientific minds can’t crack a technical problem quickly (take for instance, the painfully slow evolution of battery technology in recent decades), … In the larger sense, we really need to start thinking hard about how our societies – especially those that are already very rich – can maintain their social and political stability, and satisfy the aspirations of their citizens, when we can no longer count on endless economic growth.
Discussion • Economics vs. Physical Science 1.) How does economics deal with a finite resource like oil? 2.) How does economics deal with rapid transitions when oil 0? • Economics vs. Government 1.) When must government (regulation law) enter the discussion? 2.) Do you anticipate the need for new laws to deal with new resources? 3.) Are international laws relevant in energy considerations? • Economics vs. Ethics 1.) When do social justice issues enter in energy law?
Climate Unfriendly: COAL - $2.9B tax sub. ELEC - $3.1B elec. transmission upgrades OIL/GAS - $2.6B Deep water drilling - $0.5B LNG import terminals Offshore Oil/Gas Inventory Not in the bill: CAFE standards increase ANWR drilling Budget bill MBTE additive cleanup protection Climate Friendly: CONS. & E. EFF. - $1.3B ALTERNATIVE FUELS – $1.3B RENEWABLE ELEC. PROD CREDIT - $2.7B (wind, solar, geothermal elec. generation) DAYLIGHT SAVINGS CLEAN COAL RESEARCH - $1.8B Federal Energy Policy Act (signed into law on Aug. 8, 2005)
Energy, Conflict, and War • Daniel Yurgin - The Prize, WWII – Japan and Indonesia, Germany and The Caspian Sea • Angola • Columbia & Venezuela • Iraq • Iran • 2002 OIL (in green) • US (20 Mbbl/d) – 0.3B • China (5Mbbl/d) – 1.4B • India (2Mbbl/d) – 1.2B