Download
1 / 26
260 likes | 265 Views
The Sustainability of Health Spending Growth. Glenn Follette Louise Sheiner Federal Reserve Board. Historically, spending growth on health has exceeded that of consumption. Health Spending Projections.

E N D
The Sustainability of Health Spending Growth Glenn Follette Louise Sheiner Federal Reserve Board
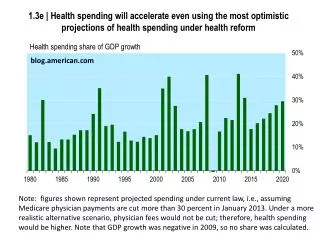
Historically, spending growth on health has exceeded that of consumption
Health Spending Projections • Since 1970, per capita health spending has grown an average of 2-1/2 percentage points faster than per capita GDP. • Obviously, health spending cannot continue to grow faster than consumption (or GDP) forever. • Until 2001, Medicare Trustees assumed per capita health care spending growth would slow to the rate of per capita GDP growth. • Since 2001, Trustees have assumed that per capita health care spending growth would slow to a rate 1 percentage point faster than per capita GDP. This has been called the assumption of 1 percentage point excess cost growth.
Sustainability of Excess Cost Growth from a Macroeconomic Perspective • Any rate of excess cost growth will eventually crowd out all of GDP and will be unsustainable. • One rationale for the Trustees’ assumptions for the next 75 years is that, even with such cost growth, real per capita non-health consumption continues to grow, although slower than per capita GDP. No absolute crowd-out of non-health consumption. • Note that what matters for real crowd-out is the share of health spending in consumption: • In particular, crowd-out occurs when the share of health spending in consumption is equal to the ratio of the growth rate of income divided by the growth rate of health spending.
1 percent excess cost growth and 1.5 percent per capita GDP growth, crowd-out starts to occur when health spending reaches 60% of consumption
With 1.5 percent excess cost growth, crowd-out starts when health spending reaches 50% of consumption.
With 2.0 percent excess cost growth, crowd-out begins at 43% of consumption.
Crowding out criteria suggests 1 percent excess growth is upper bound over the century • Under baseline macroeconomic projections, health spending reaches 40% of consumption by 2080; just getting close to real crowd-out. • With 1.5 percent excess cost growth, health spending would reach 67% of consumption – crowd-out has begun. • With 2 percent excess cost growth, health spending would reach 93% of consumption – non-health consumption is declining rapidly.
Sustainability of Excess Cost Growth from a More Microeconomic Perspective • On average, real consumption continues to grow even with 1 percent excess cost growth. But, is this true across groups? • Low-income might already spend a larger share of income on health spending, which would lead to earlier crowd out. • Elderly or others with high medical expenses might also already have larger share of income on health spending. • Projection of 1 percent excess cost growth assumes that only force driving health care cost growth in future will be exogenous technological growth. • Implicitly assumes that insurance markets and public sector involvement in health care remain stable. Is this reasonable? Or will increases in health spending itself engender changes in public and private insurance?
Private health spending as a share of income has been relatively flat
Simulations • We took 2002 data of the distribution of income and public and private health spending for elderly and non-elderly • We projected them forward to 2080 using 1 percent excess growth, maintaining 2002 public share of health spending adjusted for Medicare drug benefit
Simulation Results • Under 1 percent excess cost growth assumption, private shares of spending increase over time, but most quintiles do not reach the point where private health spending is 60% of income and starts to crowd out other consumption. • This is because the public share of health spending is very high, particularly for elderly. • Note that, even under these conditions, many individuals will face real crowd-out, because we don’t have perfect insurance (i.e., private health spending will still rise if you get sick).
Caveats • Note that this exercise does not take into account the taxes necessary to finance the large rise in public health spending built into the baseline. • If these taxes were to be levied predominantly on top 2 or 3 quintiles, then health spending might still not crowd out other spending. • But if these taxes were more evenly distributed, then lower-income groups would likely face real crowd out (since increased taxes would crowd out non-health spending).
History of Public Response • History indicates that there will be more pressure on public spending than this. Public spending tends to increase as health spending burden increases. • One reasonable view of recent history is that public spending increases to keep private spending constant as a share of income. • Another approach is to examine the relationship between the public share of spending and the total burden on health spending.
Private share of income stays relatively constant while public role grows
Public share is larger when health spending is a higher share of income
Simulation: Public Share Rises Above Baseline • To get an idea of the potential costs were this trend to continue, we simulate two alternatives: • Alternative A: We raise public spending to keep private spending for elderly and non-elderly constant at 2002 level. • Alternative B: We estimate public spending via a regression analysis of past trends. • Chart shows the additional government spending necessary for these alternatives. • Alternative A: By 2030 and thereafter, public health spending would be 50 percent higher than baseline. • Alternative B: By 2030, public health spending would be 16 percent higher than baseline; by 2080: it would be 30 percent above baseline.
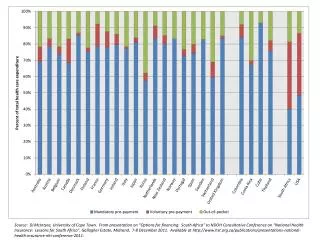
Structure of Insurance • One striking fact is that the share of out-of-pocket spending as a share of income has been very flat over time. • This has been accomplished by a significant decline in the share of health spending that is financed through out-of-pocket payments. • A lower out-of-pocket share of health spending might be a reasonable response to increasing health costs: A constant share might make health care unaffordable and/or provide too little insurance. • Implicit baseline assumptions: out-of-pocket payments constant share of health spending. • Alternative assumption: out-of-pocket shares continue to decline over time. Under this assumption, out-of-pocket spending as a share of health spending is halved by 2050, and about 40 percent by 2080. • Assuming price elasticity of health spending is .2, alternative assumption would raise spending by 3% in 2030, 9% in 2050, and 12% in 2080. • This increase in health spending would raise public spending by the same percentages.
Out-of-pocket expenses have been stable as a share of income, except among poor elderly (Medicare drug benefit will help reverse this)
Conclusions • From a macroeconomic perspective, 1 percent excess cost growth is feasible although difficult. • From a microeconomic perspective, 1 percent seems more problematic. • Because public share of spending is so large, most income groups will not face crowd out non-health consumption. • However, federal health spending, already difficult to sustain in baseline, will likely face additional demands. • Also, higher health costs will likely raise demands for more complete insurance, giving rise to further health spending pressures (or making it even harder to achieve 1 percent).