Download
1 / 30
310 likes | 455 Views
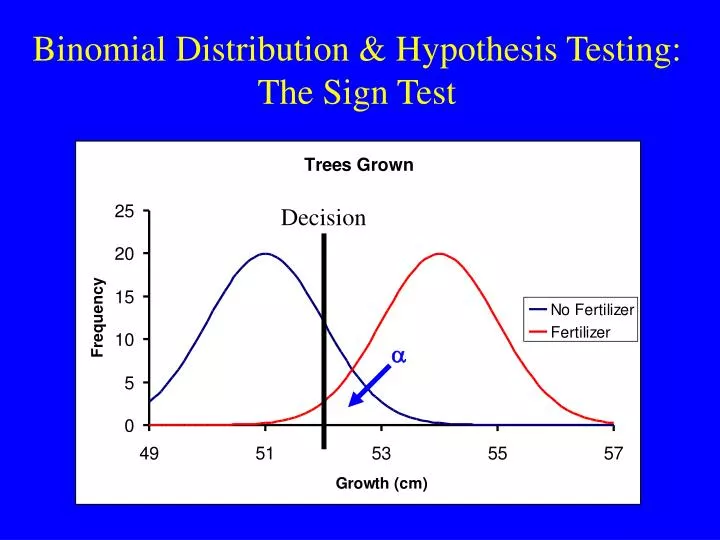
Decision. a. Binomial Distribution & Hypothesis Testing: The Sign Test. The formal steps of hypothesis testing:. Step 1: State your hypotheses. Step 2: Find the critical value. Step 3: Calculate the obtained statistic. Step 4: Make a decision. Hypotheses: Types and Tails.

E N D
Decision a Binomial Distribution & Hypothesis Testing: The Sign Test
The formal steps of hypothesis testing: Step 1: State your hypotheses. Step 2: Find the critical value. Step 3: Calculate the obtained statistic. Step 4: Make a decision.
Hypotheses: Types and Tails You must always report TWO hypotheses: H0: The null hypothesis. (outcome due to chance alone) H1: The alternative hypothesis. (specific outcome due to IV)
Hypotheses: Types and Tails Hypotheses can be ONE or TWO-tailed: This coin is weighted for tails. (directional) This coin is weighted. (nondirectional)
Example: Two-Tailed. “I think this coin is weighted” H0: This coin is not weighted. H1: This coin is weighted.
Example: One-Tailed. “I think this coin is weighted for tails” H0: This coin is not weighted for tails. H1: This coin is weighted for tails.
Example: One-Tailed. “I think this coin is weighted for heads” H0: This coin is not weighted for heads. H1: This coin is weighted for heads.
Example: One-Tailed. “I think this coin is weighted for heads” Number of Heads H0: This coin is not weighted for heads. H1: This coin is weighted for heads.
The formal steps of hypothesis testing: Step 1: State your hypotheses. Step 2: Find the critical value. Step 3: Calculate the obtained statistic. Step 4: Make a decision.
The Critical Value of an Inferential Statistic H0: This coin is not weighted for tails. ? ? H1: This coin is weighted for tails. ? Critical Valueof the statistic is the value that demarcates our decision about whether something is normal vs. abnormal. (also, our decision to either support or provide support against a hypothesis).
An Experiment How can we determine whether or not our hypothesis is correct? We need a rule to decide whether or not the probability of obtaining the outcome we obtained is likely to be due to chance. We need a decision rule. Alpha level (a): a probability level set by the investigator to delineate which outcomes will lead to supporting the alternative hypothesis. Common conventions: .05 or .01
Finding the Critical Value a = .05 H0: This coin is not weighted for tails. H1: This coin is weighted for tails. .0370 .0000 .0000 .0148 .0002 .0046 .0011 Only 15+ tails yields a probability of .05 (without going over). So the critical value is 15.
Finding the Critical Value a = .05 H0: This coin is not weighted for heads. H1: This coin is weighted for heads. .0370 .0000 .0000 .0148 .0002 .0046 .0011 Only 5 and less tails yields a probability of .05 (without going over). So the critical value is 5.
Finding the Critical Value a = .05 H0: This coin is not weighted. H1: This coin is weighted. .0370 .0370 .0000 .0000 .0000 .0000 .0148 .0148 .0002 .0002 .0046 .0046 .0011 .0011 5 and less or 15+ yields a probability of .05 (without going over). So the critical values are 5 and 15.
Finding the Critical Value a = .01 H0: This coin is not weighted for tails. H1: This coin is weighted for tails. .0000 .0000 .0148 .0002 .0046 .0011 Only 16+ tails yields a probability of .01 (without going over). So the critical value is 16.
Finding the Critical Value a = .01 H0: This coin is not weighted for heads. H1: This coin is weighted for heads. .0000 .0000 .0148 .0002 .0046 .0011 Only 4 and less tails yields a probability of .01 (without going over). So the critical value is 4.
Finding the Critical Value a = .01 H0: This coin is not weighted. H1: This coin is weighted. .0000 .0000 .0000 .0000 .0002 .0002 .0046 .0046 .0011 .0011 3 and less or 17+ yields a probability of .01 (without going over). So the critical values are 3 and 17.
The formal steps of hypothesis testing: Step 1: State your hypotheses. Step 2: Find the critical value. Step 3: Calculate the obtained statistic. Step 4: Make a decision.
For the sign test, the obtained statistic is the result of the flip! The question will usually give you this information. For example: I think a coin is weighted for tails so I flip it 20 times and I get 16 tails. Therefore, 16 tails is the obtained statistic.
The Critical Value of an Inferential Statistic a • aandb are probabilities that correspond to different range of outcomes. They are mutually exclusive and exhaustive. • As we increase alpha then beta must decrease and vice versa • As we change alpha we also change the critical value & vice versa.
The formal steps of hypothesis testing: Step 1: State your hypotheses. Step 2: Find the critical value. Step 3: Calculate the obtained statistic. Step 4: Make a decision.
In Statistics, we do NOT prove ourselves right. It is not appropriate to say “the alternative hypothesis was right.” Instead, we use very specific terminology: Everything is relative to the null hypothesis: Two types of decisions or outcomes: RETAIN the null hypothesis. REJECT the null hypothesis.
The Critical Value of an Inferential Statistic a “rejection region” • aandb are probabilities that correspond to different range of outcomes. They are mutually exclusive and exhaustive. • As we increase alpha then beta must decrease and vice versa • As we change alpha we also change the critical value & vice versa.
The Critical Value of an Inferential Statistic Retain The Null Reject the Null Conclude that the coin is indeed weighted for tails. Conclude that the coin is not weighted for tails. • aandb are probabilities that correspond to different range of outcomes. They are mutually exclusive and exhaustive. • As we increase alpha then beta must decrease and vice versa • As we change alpha we also change the critical value & vice versa.
A researcher is interested in determining whether or not a coin used to determine order of play during a basketball game is weighted for tails. He flips the coin 20 times. He flips the coin and gets 16 tails. Test his hypothesis. (use an alpha of .05) .0370 .0000 .0000 .0148 .0002 .0046 .0011 Step 1: State the null and alternative hypotheses: H0: The coin is not weighted for tails. H1: The coin is weighted for tails. Step 2: Find the critical value. Only 15+ tails will yield a p-value of .05 (without going over).
A researcher is interested in determining whether or not a coin used to determine order of play during a basketball game is weighted for tails. He flips the coin 20 times. He flips the coin and gets 16 tails. Test his hypothesis. (use an alpha of .05) Step 3: Calculate the test statistic: 16 tails Step 4: Make a decision: Reject the null hypothesis. The coin is weighted for tails.
Suppose it is your job to test whether a coin used at the start of a hockey game is weighted. You flip it 12 times and it comes up tails 10 times. Test the hypothesis that the coin is weighted using an alpha level of .01. Step 1: State your null and alternative hypotheses: H0: The coin is not weighted. H1: The coin is weighted. Step 2: Find the critical value: 0 1 2 3 4 5 6 7 8 9 10 11 12 .0161 .0161 .0029 .0029 .0002 .0002 0 1 2 3 4 5 6 7 8 9 10 11 12 Number of Tails
Step 3: Calculate the test/obtained statistic: 10 Step 4: Make a decision. We retain the null hypothesis. 0 1 2 3 4 5 6 7 8 9 10 11 12 Number of Tails .0029 .0029 .0002 .0002
There are 100 students in my Statistics class: 50 females and 50 males I have a sneaking suspicion that the brightest students are female (sorry guys!). I would like to test this hypothesis using an alpha level of .05. I make a list of the students according to their test grade and isolate the top 15 students in the class. 10 of them are females. .0417 .0139 .0032 .0005 .0000 0 1 2 3 4 5 6 7 8 9 10 11 12 13 14 15 Number of Females
Hypothesis testing with the Sign Test Analysis A decision rule based on the probability of the outcome or a more extreme one being due to chance runs the risk of two types of errors. State of Reality Decision H0 is true H0 is false Retain H0 Correct Decision Type II error Reject H0 Type I error Correct Decision