Download
1 / 26
260 likes | 326 Views
Imre Kondor Collegium Budapest and Eötvös University, Budapest Large Databases in Social and Economic Complex System Research, Jerusalem, September 17, 2008. Instability of Portfolio Optimization under Coherent Risk Measures. C oauthor.

E N D
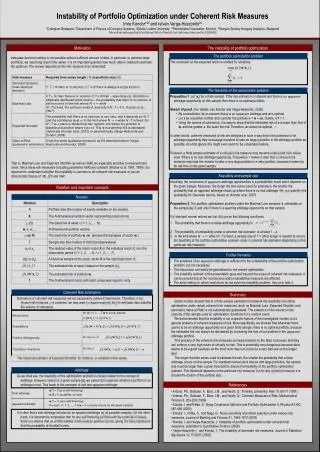
Imre Kondor Collegium Budapest and Eötvös University, Budapest Large Databases in Social and Economic Complex System Research, Jerusalem, September 17, 2008 Instabilityof Portfolio Optimization under Coherent Risk Measures
Coauthor István Varga-Haszonits (ELTE PhD student and Analytics Department of Fixed Income Division,Morgan Stanley, Budapest, Hungary)
Preliminaries The proper choice of risk measures (basically the fundamental objective function) is of central importance in finance. The widest spread risk measure today is VaR which, as a quantile, has no reason to be convex. A non-convex risk measure violates the principle of diversification, does not allow the correct pricing and aggregation of risk, and cannot form the basis of a consistent limit system. As a remedy to VaR’s shortcomings the concept of coherent risk measures were introduced by Artzner at al. in 1999 (Ph. Artzner, F. Delbaen, J. M. Eber, and D. Heath,Coherent measures of risk,Mathematical Finance,9, 203-228, (1999). This work triggered a tremendous response: there are 489 papers citing it on Gloriamundi
Preliminaries II In a recent paper (I. K., Sz. Pafka, G. Nagy: Noise sensitivity ofportfolio selection under various risk measures, Journal of Banking and Finance, 31, 1545-1573 (2007)) we investigated the risk sensitivity of various risk measures (variance, mean absolute deviation, expected shortfall, maximal loss) and found that the estimation error diverges at a critical value of the ratio N/T, where N is the number of securities in the portfolio and T is the sample size (the length of the time series per item).
Furthermore, we realised that for some risk measures portfolio optimisation does not always have a solution. Of course, for small samples (T < N) the optimisation task never has a solution for any of the risk measures – this is a triviality. However, for T > N it isalways possible to find a solution for the variance and MAD, but the feasibility of the optimization under ES or ML is not guaranteed, it is a probabilistic issue, the existence of a finite solution depends on the sample.
The case of Maximal Loss Definition of the problem (for simplicity, we are looking for the global minimum and allow unlimited short selling): where the w’s are the portfolio weights and the x’s the returns.
Probability of finding a solution for the minimax problem (for elliptic underlying distributions):
The calculation of the probability of a solution is equivalent to some problems in operations research or random geometry:Todd, M.J., Probabilistic models for linear programming, Math. Oper. Res. 16, 671-693 (1991). In the limit N,T→ ∞, with N/T fixed, the transition becomes sharp at N/T = ½.
Interpretation of the instability For ML it is easy to see that the risk measure becomes unbounded from below if and only if it is possible to form a portfolio that dominates all the others on the given sample. We say that portfolio u dominates (strictly dominates) portfolio v(notation , resp. ) if the return on u is larger or equal (strictly larger) than the return on v for each time period in the sample.
Expected Shortfall ES is the average loss above a high threshold defined in probability, not in money (ES is sometimes called CVaR). Optimisation under ES can be reduced to linear programming.(R.T. Rockafellar and S. Uryasev,Optimization of Conditional Value-at-Risk,The Journal of Risk,2,21-41 (2000) Maximal Loss is a limiting case of ES, corresponding to the threshold going to 1. Both ML and ES are coherent measures(C. Acerbi and D. Tasche,On the Coherence of Expected Shortfall,Journal of Banking and Finance,26,1487-1503 (2002)) in the sense of Artzner & al.
Feasibility of optimization under ES Probability of the existence of an optimum under CVaR.F is the standard normal distribution. Note the scaling in N/√T.
With increasing N, T (N/T= fixed) the transition becomes sharper and sharper…
…until in the limit N, T→∞ with N/T= fixed we get a „phase boundary”. The exact phase boundary has been obtained by A. Ciliberti, I. K., and M. Mézard:On the Feasibility of Portfolio Optimization under Expected Shortfall, Quantitative Finance, 7, 389-396 (2007), fromreplica theory.
For ES the presence of a dominating portfolio is sufficient (but not necessary) for the nonexistence of a solution (a dominating combination of items will do). The observations made on ML and ES can be generalized to any measure satisfying the coherence axioms: defined on the sample X
Theorem 1. If there exist two portfolios u and v so that then the portfolio optimisation task has no solution under any coherent measure. Theorem 2. Optimisation under ML has no solution, if and only if there exists a pair of portfolios such that one of them strictly dominates the other. Neither of these theorems assumes anything about the underlying distribution.
For elliptically distributed underlyings we can say more: Corollary 1: For elliptically distributed items the probability of the existence of a pair of portfolios such that one of them dominates the other on a given sample Xis 1-p(N,T). (Think of the minimax.) Corollary 2: The probability of the unfeasibility of the portfolio optimisation problem under any coherent measure on the sample X is at least 1-p(N,T)if the underlying assets are elliptically distributed. Corollary 3: If there is a sharp transition in the limit N,T→ ∞, with N/T fixed also for coherent risk measures other than ML or ES, then their critical N/T ratio is smaller or equal to ½, for elliptical distributions again.
Summary and extension The coherence axioms imply that for finite T there will always be samples for which the portfolio optimization cannot be carried out under a given coherent risk measure, because the measure becomes unbounded from below. Paradoxically, this instability is related to a very attractive feature of coherent measures: if one of the assets dominates the rest for all times, that is for infinitely large samples, then the coherent measures signal this by going to minus infinity.
It may happen, however, that in a given finite sample a single asset dominates the others even if there is no such dominance relationship between them for infinitely long observation periods, and the coherent measures become unbounded from below also in this case, thereby giving a false signal.
Constrained optimization We have allowed unlimited short selling so far. If short selling is excluded, or any other set of constraints that limit the domain of the problem are imposed, the instability shows up by the solutions sticking to the walls of the allowed region, and jumping around from sample to sample. Constraints do not solve the problem of instability, just mask it.
Coherent measures grasp some of the most important features of risk. However, in addition to mathematical consistency, robustness to sample to sample fluctuations is also a desirable property of risk measures.
The above findings can be generalized to the even larger class of downside risk measures, including VaR. VaR is a quantile, the loss beyond which a given percentage (like 5% or 1%) of the worst losses reside. Historical VaR is not convex. We can consider parametric VaR, however, by fitting e.g. a Gaussian to the row data, and using its variance as a risk measure. This way we can deduce a new phase diagram, somewhat similar to the ES case, along which the instability sets in.
Portfolio optimization suffers from the lack of sufficient data. We are trying to extract more information from the data than what they contain, and this leads to overfitting. Some kind of complexity control is needed, but not an artificial one like imposing a ban on short selling. Methods taken over from machine learning theory are being considered in our group.