Download
1 / 10
100 likes | 215 Views
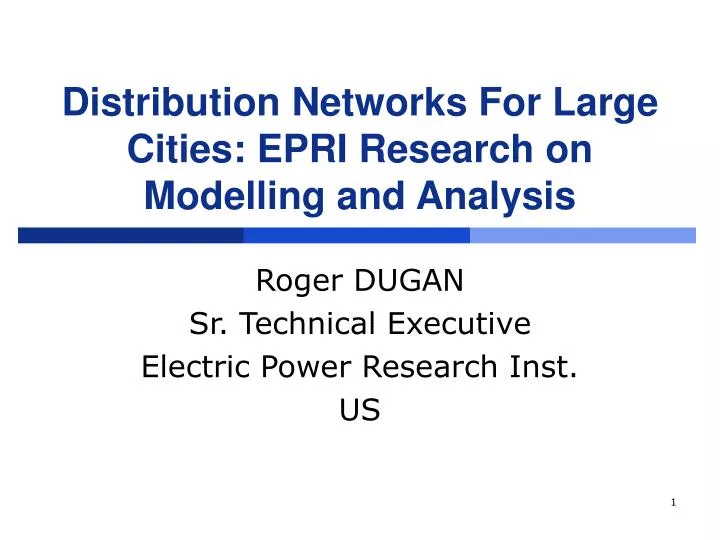
Distribution Networks For Large Cities: EPRI Research on Modelling and Analysis. Roger DUGAN Sr. Technical Executive Electric Power Research Inst. US. Areas of Research in Network Analysis. Power flow studies Annual simulations of large networks State estimation

E N D
Distribution Networks For Large Cities: EPRI Research on Modelling and Analysis Roger DUGAN Sr. Technical Executive Electric Power Research Inst. US
Areas of Research in Network Analysis • Power flow studies • Annual simulations of large networks • State estimation • Identifying open secondary cables • AMI penetration required for accurate • Power delivery efficiency
Network A Solution in OpenDSS Max pu. voltage = 1.0288 Min pu. voltage = 0.97399 Total Active Power: 150.547 MW Total Reactive Power: 90.1549 Mvar Active Losses: 3.60457 MW, (2.394 %) Reactive Losses: 39.0243 Mvar current-weighted point-to-point plotusing bus XY coordinates only 2,118 Buses 1,046 Primary Cables 1,552 Secondary Cables 235 Transformers 311 Secondary Load Points 2 Controlled Cap Banks 7 Tap Changer Controls
Network B Solution in OpenDSS Max pu. voltage = 1.0617 Min pu. voltage = 0.94585 Total Active Power: 290.822 MW Total Reactive Power: 142.377 Mvar Total Active Losses: 12.7533 MW, (4.39 %) Total Reactive Losses: 56.323 Mvar current-weighted point-to-point plotusing bus XY coordinates only 10,132 Buses 17,818 Line Segments 552 Transformers 2,272 Load Points + 10 other 4 Controlled Cap Banks 8 Tap Changer Controls
Network Protector Modelling • Found Only on Secondary Networks • Incorporates interrupter, communications, PTs, and CTs • Open Control – Reverse Power Flow • Close Control – Differential Voltage and Phasing
State Estimation Example • Can we identify secondary cable outages with AMI? • Interval demand measurements of real-time loads • Need voltage measurement to 1 decimal • Hard to distinguish parallel cables, or within a set SNL BC_5005 USN 1467 (6 in ║) USN 1468 (8 in ║) S=635.56 + j393.88 kVA • For the same load, a high residual in theestimated voltage may show: • Some of the feeding cables are out • Not enough change if just 1 of 14 out • Can’t distinguish which of the 14 are out
Summary • Work is continuing on research into analysis and modelling of large, multi-phase urban networks • State estimation/fault location • Efficiency • One of the models we are studying will be converted to an IEEE Test Feeder in 2011