1 / 1

Fig. 1 The Rate of Inflation Using Consumer Price Index, 1950-2003

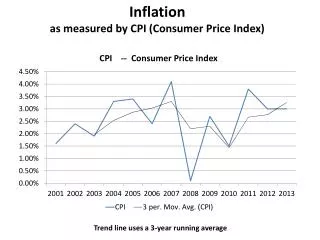
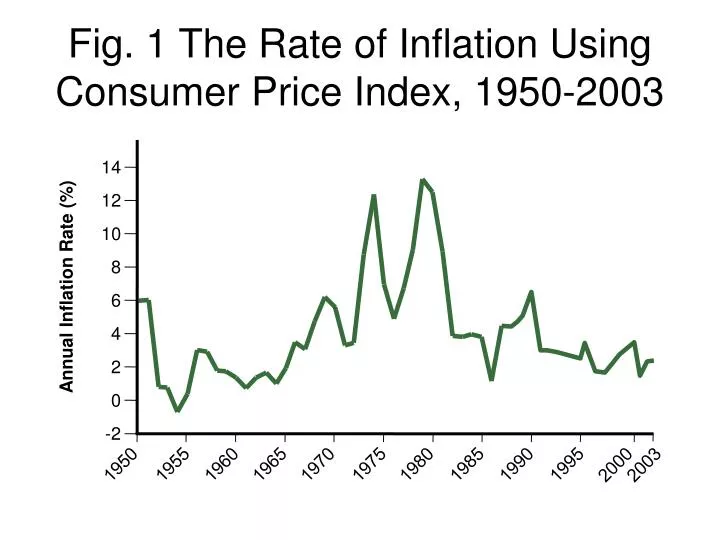
14. 12. 10. 8. Annual Inflation Rate (%). 6. 4. 2. 0. -2. 1950. 1955. 1960. 1965. 1970. 1975. 1980. 1985. 1990. 1995. 2000. 2003. Fig. 1 The Rate of Inflation Using Consumer Price Index, 1950-2003.

Download Presentation

Fig. 1 The Rate of Inflation Using Consumer Price Index, 1950-2003

An Image/Link below is provided (as is) to download presentation Download Policy: Content on the Website is provided to you AS IS for your information and personal use and may not be sold / licensed / shared on other websites without getting consent from its author. Content is provided to you AS IS for your information and personal use only. Download presentation by click this link. While downloading, if for some reason you are not able to download a presentation, the publisher may have deleted the file from their server. During download, if you can't get a presentation, the file might be deleted by the publisher.

E N D

Presentation Transcript


  1. 14 12 10 8 Annual Inflation Rate (%) 6 4 2 0 -2 1950 1955 1960 1965 1970 1975 1980 1985 1990 1995 2000 2003 Fig. 1 The Rate of Inflation Using Consumer Price Index, 1950-2003

More Related