Download
1 / 133
1.33k likes | 1.47k Views
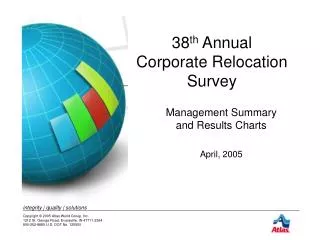
39 th Annual Corporate Relocation Survey. Management Summary and Results Charts April, 2006. Table of Contents. Section Slide Number Foreword…………………………………………………………………………………….3 Situation Analysis 3 Methodology 3 Management Summary…………………………………………………………………… 4-23

E N D
39th Annual Corporate Relocation Survey Management Summary and Results Charts April, 2006
Table of Contents Section Slide Number Foreword…………………………………………………………………………………….3 Situation Analysis 3 Methodology 3 Management Summary…………………………………………………………………… 4-23 Corporate Profile 4 Factors Impacting Transfers 8 Policy Administration 10 Relocation Costs 13 Employee, Spousal & Assistance Issues 15 Transportation 18 International 19 Respondent Profile 23 Survey Graphs……………………………………………………………………………… 24-132 Corporate Profile 24 Factors Impacting Transfers 44 Policy Administration 48 Relocation Costs 62 Employee, Spousal & Assistance Issues 75 Transportation 91 International 105 Respondent Profile 121 2
Foreword Situational Analysis • Atlas World Group conducts corporate relocation issues research on an annual basis. This is the fourth year the study has been conducted via the Internet. Invitations to participate in the survey were sent to mailing lists of selected relocation-related publications and associations. In order to qualify for the survey, a respondent must: 1) have relocation responsibility and 2) work for a company that has either relocated employees within the past two years or plans to relocate employees this year. • For the 39th Annual Corporate Relocation Survey, Atlas World Group utilized OpinionWare, a software tool developed by SilkRoad Technology for building and conducting survey research on the Internet. Methodology • For the year 2006, 421 surveys were completed by qualifying participants online from January 25 through February 28. Multiple choice questions add to 100% (+/- 1%) due to rounding. Other questions totaling above 100% are due to multiple responses. 3
Management Summary • Corporate Profile • Fifty percent of the companies involved in this study employ less than 500 salaried workers, and the other half employ 500-4,999 salaried employees or 5,000 or more salaried employees (29% and 21% of respondents, respectively). • Service and Manufacturing/Processing companies were the most highly represented business classifications in this study (43% and 41%, respectively). • Roughly half of participating companies are international (49%). Large companies (5,000+ salaried workers) surveyed are more likely to be international: nearly twice as many large companies (73%) are international than small companies (35%). The percentage of mid-size firms indicating they are international increased slightly from last year, moving up from 48% to 55%. • The median annual sales range for all companies involved in this study is $100-$499 million. The median annual sales range for companies with less then 500 employees is $26-$99 million, while for companies with 500-4,999 employees it is $500-$1 billion, and for companies with more than 5,000 employees it is over $1 billion. 4
Management Summary Corporate Profile (cont.) • Over one-fourth (28%) of firms responding anticipate an increase in the number of relocations in 2006, which, though down slightly, is similar to the 33% who expected increases in 2004 & 2005. Also, 31% of respondents expect relocation budgets to increase in 2006, which is similar to the percentages (32% & 29%, respectively) who thought so in 2004 & 2005. Company size continues to be playing a role in projections for 2006 as in prior years, with 38% of large firms indicating they expect relocation volume to increase in 2006, while just roughly a fourth of mid-size and small firms indicate they expect increases. • Similar to findings in 2004 and 2005, around half of firms, regardless of size, expect relocation volumes and budgets to stay the same in 2006. Only 20% expect a decrease in relocation volume, similar to last year (16%). Correspondingly, only 17% expect relocation budgets to be lower this year than last, similar to the 14% of firms who last year expected decreases. 5
Management Summary Corporate Profile (cont.) • Forty-three percent of the companies surveyed indicated approximately the same number of employee relocations in 2005 as they did in the previous year. Forty-four percent indicated they saw increases over 2004 volume, while 13% indicated relocations decreased from 2004 levels. Like last year, company size appears to have been a factor in 2005 relocation volume. Roughly forty percent of mid-size and small firms reported increases in relocation volumes, and another half indicated volumes held steady. The majority (53%) of large firms indicated 2005 volume increased over 2004, while only a third stated volumes remained the same. • Companies surveyed reported a median range of 10-19 employee relocations in 2005 (small companies reported a median range of 1-9, mid-sized companies 20-49, and large companies 200-399). • Around fifty percent of the mid-size and large companies surveyed had more money for relocations in 2005 as they did in the previous year. For small companies, over a third (37%) indicated that budgets had increased, with just 9% of all companies responding indicated their budgets decreased. 6
Management Summary • Corporate Profile (cont.) • Roughly three-fourths of the companies surveyed indicated that their overall financial performance in 2005 was better than 2004. The majority of firms stated this was the case, regardless of companies size, although large firms were more likely than small or mid-size firms to express this sentiment (70% of small and 72% of mid-size companies vs. 85% of large firms). Responding firms also anticipate positive financial performances in 2006 as the majority of all size firms indicate they expect 2006 to be better than 2005 (76% of small, 69% of mid-size, and 84% of large firms). • About half of all firms, regardless of size, indicated they thought the U.S. economy in 2005 was better than the previous year and anticipate the U.S. economy in 2006 will be better than in 2005. • Seventy-five percent of the companies surveyed have a formal relocation policy. Companies with 500 or more employees are more likely to have a formal relocation policy than are smaller companies (98% of large and 88% mid-size companies vs. 58% small companies). 7
Management Summary • Factors Impacting Transfers • Over three-fourths of respondents indicated at least one external factor had a significant impact on the number of employee transfers in 2005. Overall, the “lack of qualified people locally” (58%) was the top reason indicated, followed by “economic conditions” (28%). • The impact of “lack of qualified people locally” continued to rise in importance from 48% in 2004 and 37% in 2003. Additionally, for the first time in the past four years, “lack of qualified people locally” was the top issue for large firms (51%), surpassing “economic conditions” (42%). • In 2005, over a third (35%) of large firms indicate one form of competition (domestic or international) had a significant impact on relocation volume, similar to 2004 (36%), which is significantly above the twenty percent who indicated as such for 2003. • For large companies, domestic natural disasters also appeared to play a greater role in 2005 relocation, with 21% of these companies indicating these events had a significant impact. 8
Management Summary • Factors Impacting Transfers (cont.) • Similar to last year, roughly half or more of firms, regardless of company size, indicated “growth of the company” as the top internal factor relocation in 2005. Additionally, the percentage of large firms indicating this factor was significantly above 2004 (69% vs. 52%). While “promotions/resignations,” “knowledge/skills transfers” and “ corporate reorganization” are the second-, third-, and fourth-place internal factors, the percentage of firms indicating “budget constraints” dropped regardless of company size for the second straight year. • For mid-size and large companies, there was an increase over 2004 in the percentage citing “promotions/ resignations” as a factor in relocation volume in 2005 (51% vs. 42% and 57% vs. 45%, respectively). There was also an increase in the percentage of large companies citing “expansion into new territories” and “expansion of facility” as impacting 2005 relocation volume compared to 2004 (38% vs. 27% and 33% vs. 26%, respectively). 9
Management Summary • Policy Administration • Seventy-four percent of the firms surveyed indicate the company is actively involved in selecting the household goods carrier for an employee’s relocation, whether as the sole selector or in conjunction with the employee. This percentage is similar across company size, although mid-size and large firms are more likely than small firms to be the sole selector (52% and 61% vs. 28%, respectively). • Mid-size and large firms are more likely to than small firms to delegate carrier selection to a relocation firm (20% and 25% vs. 4%, respectively). • Of the companies involved in carrier selection, the department responsible for selection varies by companies size. • Human Resources at small or mid-size firms is more likely to be responsible for carrier selection than at large firms (89% and 73% vs. 36%). The majority of large firms (67%) indicate that the Relocation department has this responsibility. Mid-size & large companies are also more likely than small firms to have more than one department involved in selecting the carrier (20% and 23% vs. 8%, respectively). 10
Management Summary • Policy Administration (cont.) • Over 5 out of 6 (85%) of the large companies surveyed have a centralized department that handles relocation, similar to 89% of mid-sized companies and 84% of the small companies. Most of the companies’ centralized relocation departments are responsible for developing relocation policy, controlling household goods carrier selection, managing domestic relocation programs, and controlling additional relocation services provider(s) selection. • Companies vary on the amount of time they allow employees to decide on whether to accept a relocation offer. One-fifth (20%) of the companies surveyed allow one week or less to accept or decline an offer, 42% of the companies surveyed allow up to two weeks, and 20% allow up to one month to decide. • The majority (79%) of companies surveyed allow the hiring of spouses of current employees. Small and mid-size companies, however, are somewhat less likely to hire spouses than large companies (74% and 79% vs. 91%, respectively). 11
Management Summary • Policy Administration (cont.) • Fifty-five percent of all companies outsourced relocation services in 2005, down from 63% in 2004 and 66% in 2003. Only thirty percent of small companies outsourced, while 74% of mid-size companies and 88% of large companies outsourced relocation services. • The services that are outsourced by close to a third or more of companies responding are: • - Real estate sales/marketing (36%) • - Real estate purchase (33%) • Contract of household goods moving company (30%) • Seventy-seven percent of decision makers say that the Internet was used for relocation-related matters in 2005. The top use was to communicate via e-mail with relocating employees (67%) followed by researching relocation-related matters (46%). Sixty percent or more of large companies also indicated they used the Internet to access their relocation company website for reporting/other services and for completing online forms for transferees (63% and 60%, respectively). • Employees are allowed on average 4.5 expense-paid house-hunting days. Spouses of relocating employees are allowed an average of 1.5 expense-paid house-hunting trips. 12
Management Summary • Relocation Costs • The following are companies’ methods of reimbursement of moving expenses of TRANSFEREES and NEW HIRES: • The percentage of firms offering full reimbursement of relocation expenses to transferees and new hires decreased significantly from last year (58% vs. 69% and 43% vs. 56%, respectively). Corresponding to these changes, increases are also seen in the percentage of firms offering lump sum payments or partial reimbursement for relocation costs. The majority of firms responding still offer full reimbursement as an option for transferees, however, this is no longer true for new hires. • Most firms report that carrier transportation expenses are “paid directly by the company” regardless of company size. However, the percentage of small firms paying these expenses directly decreased significantly from last year (59% vs. 71%). 13
Management Summary • Relocation Costs (cont.) • The majority of all companies have different tiers, or levels, in their relocation policies, although mid-size and large firms are more likely than small firms to have these in place (85% and 93% vs. 67%, respectively). Most tier/level policies appear to be based on position/job title or general job level (i.e. staff, management, professional, etc.) and on two or more factors overall. Mid-size and large firms are more likely than small firms to use new hire/current employee or homeowner/renter status as qualifiers for their policies. • If the TRANSFEREE or NEW HIRE decides to buy a home in the new location, roughly fifty percent or more of the companies surveyed indicate they will pay for the following moving services: • - 71% to pack all items • - 68% to move an automobile • 49% to more exercise equipment • If an employee decides to rent, roughly fifty percent or more of companies responding cover the following: • 57% reimburse/pay for lease cancellation • 55% offer home finding trips • 47% offer to move one or more automobiles 14
Management Summary • Employee, Spousal & Assistance Issues • The following is the makeup of those employees transferred in 2005. • Thirty-four percent of companies surveyed indicated that the age range of their most frequently transferred employee was 36 to 40 years of age, and over seventy percent (71%) of the companies surveyed indicated some percentage of the employees they relocated were women. • Nearly 9 out of 10 (85%) of companies indicated some percentage of their relocations involved a trailing spouse who was a wife or female partner, almost two-thirds (65%) of the companies indicated that some percentage of relocations had accompanying husbands/male partners. • Thirty-eight percent of companies surveyed assist an employee’s spouse/partner in finding employment in the new location. Large companies have historically been somewhat more likely to offer spousal assistance, and this year the gap remained close last year’s results: 53% of large companies indicate they provide this assistance versus 35% of small companies. • Overall, the top method of spousal/partner assistance was to “provide networking assistance” (60%), followed by “provide resume preparation assistance.” However, large firms are more likely to “pay for outplacement/career services from a third party” than small or mid-size firms. 15
Management Summary • Employee, Spousal & Assistance Issues (cont.) • Eighteen percent of companies surveyed provide some type of elder care assistance to the transferee. However, the assistance that is provided by companies is minimal, with very few employers allowing the use of pre-tax dollars for outside care or providing moving expense coverage for the elderly relative. Responses indicate: • 8% Provide a list of nursing homes and/or day-care centers • 6% Allow the transferee to use pre-tax dollars for outside care • 5% Relocate the elderly relative who will live with the transferee in the new location • - 3% Relocate the elderly relative who does not live with the transferee • Only 13% of respondents believe that an employee’s willingness to relocate is never affected by his/her spouse’s employment status, while 44% indicate this is seldom the case. However, 43% believe that an employee’s willingness to relocate is "almost always” or "frequently" affected by the employment status of an employee’s spouse, still significantly above over 2001 & 2000 and similar to the last three years (44% in 2004, 42% in 2003 vs. 42% in 2002 vs. 17% in 2001 and 25% in 2000). Q.36 – Frequency of Employee’s Relocation Being Affected by the Employee Status of His/Her Spouse 16
Management Summary • Employee, Spousal & Assistance Issues (cont.) • Most (65%) respondents said that declining the opportunity to relocate does not hinder an employee’s career. Over half (52%) indicated they had employees decline the opportunity to relocate in 2005; however, only 33% of respondents from small companies indicated this was the case, while 62% of mid-size and 92% of large companies said they had employees decline relocation. • Eighty-four percent of respondents said that the number of employees who declined relocation offers did not change between 2004 and 2005. Eight percent said that the number of employees declining relocation offers in 2005 decreased and the same percentage said it increased. • Reasons employees gave for declining relocation in 2005 were: • - Family issues/ties (81%) • - Cost of living in the new location (54%) • - Spouse’s employment (53%) • No desire to relocate (48%) • Personal (non-disclosed) (35%) • Housing/mortgage concerns (32%) • Could hurt career (2%) • Other (1%) 17
Management Summary • Transportation • Overall, 59% of companies have contracts with household goods carriers: 39% of small companies, 74% of mid-size companies, and 88% of large companies. • Of those companies surveyed who indicated they had standing contracts with household goods carriers, the average was 1.9 standing contracts with household goods carriers (similar to last year’s 2.1). • Over two-thirds (69%) of companies surveyed with carriers under contract specify which carriers are preferred. In 2005, the percentages of companies indicating preferred carriers differed slightly by company size (74% of small and 71% of mid-size companies vs. 62% of large companies). • The most important attributes when selecting a carrier indicated by companies surveyed were*: • - Service (85%) • - Reputation (60%) • - Price (57%) - Claims Processing (47%) • - Local Agent(s) (46%) • - Technology (28%) • The most important attributes when evaluating a carrier indicated by companies surveyed were*: • - Service (88%) • - On-time delivery (78%) • - Employee feedback (71%) - Price (60%) • - Claims processing (49%) • - Extra services (30%) • - Online customer tools (22%) • * Top 2 box rating (% of respondents who indicated the attribute was “critically important” (a “9” or “10” on a 10-point scale)). 18
Management Summary • International • Forty-three percent of companies surveyed relocate employees internationally: 27% of small companies, 48% of mid-size companies, and 73% of large companies. • Thirty-nine percent of these companies indicated their international relocation volume increased in 2005, and just under a third (30%) indicate they expect increases in international relocation volume in 2006. Large firms are more likely to expect increases in international relocations in 2006 than small and mid-size firms (43% vs. 19% and 26%, respectively). However, over half of companies, regardless of size, indicate they expect 2005 relocation volume to remain unchanged from 2005. • Responding firms indicate that only 17% of 2005 international relocations were temporary (less than 12 months). Over half of firms, regardless of size, indicate the most typical assignment length is greater than 12 months, but less than three years. However, 22% expect the number of temporary assignments to increase, driven mostly by large and mid-size companies’ expectations. The majority of all firms, regardless of company size, expect unchanged volume in temporary international assignments in 2006. 19
Management Summary • International (cont.) • Of the companies surveyed who move employees internationally, respondents indicated the following additional considerations are part of their international relocation policies: • Additional tax considerations (73%) • Additional leave time (includes at least one visit to US or CAN) (61%) • Allowances for children to attend certain schools (55%) • Intercultural and language training (49%) • Additional leave time (49%) • Increased allowances for permanent storage (43%) • Higher relocation allowances (38%) • Higher rental housing allowance (32%) • Extended per diem charges for hotel (19%) • More leniency on insurance coverage (10%) • More communication equipment (phones/laptops) (9%) • Other (4%). • The most important attributes when selecting a carrier for international shipments indicated by companies were*: - Service (89%) - Scheduling (67%) - Price (65%) - Reputation (62%) - Third Party (39%) - Technology (36%) • * Top 2 box rating (% of respondents who indicated the attribute was “critically important” (a “9” or “10” on a 10-point scale)). 20
Management Summary International (cont.) • Sixty-two percent of companies who relocate employees internationally indicate they outsourced an international relocation service in 2005 (up slightly from 58% in 2004, still down from 70% in 2003). Of those companies who outsource relocation services domestically, 79% indicate they do so internationally (up from 70% in 2004, close to the 82% in 2003). • Differences in outsourcing domestically carried over to the international side by company size, as small companies (23%) are much less likely to outsource international relocation services than medium (75%) and large (83%) firms, with medium and large companies report outsourcing a greater variety of their international relocation services than small companies. 21
Management Summary International (cont.) • Roughly half (49%) of companies do not use electronic data interchange (EDI) interface capabilities on international shipments. • Two-thirds of companies (67%) offer no assistance to internationally transferred employees’ spouses/partners in finding employment in the new location. • Overall, 37% of companies that move employees internationally reported no international relocations were declined or failed in 2005 (67% of small companies, 41% of mid-size companies, and 8% of large companies). However, 22% of companies responded they did not know why an international relocation was declined or failed in 2005, with mid-size to large companies (24% and 34%, respectively) indicating they were unaware more often than small companies (5%). 22
Management Summary • Respondent Profile • Most respondents (75%) work in Human Resources/Personnel departments. There were a variety of different positions held among those who completed this survey – from managers (29%), directors (28%),vice-presidents (13%), and relocation administrators (9%), as well as a myriad of other positions, including a few presidents, department heads, supervisors, coordinators, and others. • A overwhelming majority of the respondents regularly read trade publications (95%). The most popular publications were*: • - HR Magazine (67%) • - Human Resource Executive(57%) • Workforce (26%) • Employee Benefits News (25%) • Mobility (22%). • Fifty-four percent of the total of employees interviewed belong to a relocation-related association, and over eighty percent of responding employees at large companies belong to one of these associations*. * Note: the responses to these questions may have been influenced by the respondent lists used to gather data for this survey. 23
Corporate Profile Q.1 – Business Classifications of Companies Participating Less than 500 Salaried Employees 500 – 4999 Salaried Employees Total 5000+ Salaried Employees 24
Corporate Profile Q.2 – Is your company… Total Less than 500 Salaried Employees 500 – 4999 Salaried Employees 5000+ Salaried Employees 25
Corporate Profile Q.3 – Participating Companies Annual Sales for 2005 Total Less than 500 Salaried Employees 500 – 4999 Salaried Employees 5000+ Salaried Employees 26
Corporate Profile Q.4 – Number of Salaried (Non-Hourly) People Employed by Company 27
Corporate Profile Q.5 – In 2005, was your company’s overall financial performance… Total Less than 500 Salaried Employees 500 – 4999 Salaried Employees 5000+ Salaried Employees 28
Corporate Profile Q.6 – Compared to 2005, do you anticipate your company’s overall financial performance in 2006 will be… Total Less than 500 Salaried Employees 500 – 4999 Salaried Employees 5000+ Salaried Employees 29
Corporate Profile Q.7 – In 2005, from your company’s perspective, was the U.S. economy… Total Less than 500 Salaried Employees 500 – 4999 Salaried Employees 5000+ Salaried Employees 30
Corporate Profile Q.8 – Compared to 2005, do you anticipate the U.S. economy in 2006 will be… Total Less than 500 Salaried Employees 500 – 4999 Salaried Employees 5000+ Salaried Employees 31
Corporate Profile Q.9 – Number of Employees Relocated in 2005 By Company Size (Salaried Employees) 32
Corporate Profile Q.9a – Number of Employees Relocated in 2005 Within the U.S. Less than 500 Salaried Employees 500 – 4999 Salaried Employees Total 5000+ Salaried Employees 33
Corporate Profile Q.9b – Number of Employees Relocated in 2005 Between the U.S. and Canada Less than 500 Salaried Employees 500 – 4999 Salaried Employees Total 5000+ Salaried Employees 34
Corporate Profile Q.9c – Number of Employees Relocated in 2005 Between the U.S. and Mexico Less than 500 Salaried Employees 500 – 4999 Salaried Employees Total 5000+ Salaried Employees 35
Corporate Profile Q.9d – Number of Employees Relocated in 2005 Between the U.S. and Another Country Less than 500 Salaried Employees 500 – 4999 Salaried Employees Total 5000+ Salaried Employees 36
Corporate Profile Q.9e – Number of Employees Relocated in 2005 Within a Single Foreign Country Less than 500 Salaried Employees 500 – 4999 Salaried Employees Total 5000+ Salaried Employees 37
Corporate Profile Q.9f – Number of Employees Relocated in 2005 Between Two Foreign Countries Less than 500 Salaried Employees 500 – 4999 Salaried Employees Total 5000+ Salaried Employees 38
Corporate Profile Q.10 – Compared to 2004, did the number of employees you relocated in 2005… Total Less than 500 Salaried Employees 500 – 4999 Salaried Employees 5000+ Salaried Employees 39
Corporate Profile Q.11 – Compared to 2004, did your 2005 relocation budget… Total Less than 500 Salaried Employees 500 – 4999 Salaried Employees 5000+ Salaried Employees 40
Corporate Profile Q.12 – Compared to 2005, do you anticipate that the number of employees your company will relocate during 2006 will… Total Less than 500 Salaried Employees 500 – 4999 Salaried Employees 5000+ Salaried Employees 41
Corporate Profile Q.13 – Compared to 2005, do you anticipate that your relocation budget in 2006 will… Total Less than 500 Salaried Employees 500 – 4999 Salaried Employees 5000+ Salaried Employees 42
Corporate Profile Q.14 – Companies with a Formal Relocation Policy* By Company Size (Salaried Employees) * % of companies answering “Yes” 43
Factors Impacting Transfers Q.15 – External Factors Having the Most Significant Impact on the Number of Employee Relocations in 2005 Total 44
Factors Impacting Transfers Q.15 – External Factors Having the Most Significant Impact on the Number of Employee Relocations in 2005 By Company Size (Salaried Employees) 45
Factors Impacting Transfers Q.16 – Internal Conditions Having the Most Significant Impact on the Number of Employee Relocations in 2005 Total 46
Factors Impacting Transfers Q.16 – Internal Conditions Having the Most Significant Impact on the Number of Employee Relocations in 2005 By Company Size (Salaried Employees) 47
Policy Administration Q.17 – Who Selects The Household Goods Carrier for Y our Employee’s Relocation? Total Less than 500 Salaried Employees 500 – 4999 Salaried Employees 5000+ Salaried Employees 48
Policy Administration Q.17a – Which Department(s) at Your Company Select the Household Goods Carrier?* Total * those where company is involved in selection (Q17) 49
Policy Administration Q.17a – Which Department(s) at Your Company Select the Household Goods Carrier?* By Company Size (Salaried Employees) * those where company is involved in selection (Q17) 50