Download
1 / 22
220 likes | 311 Views
Project Compass + New Star The Race to Win ThyssenKrupp’s $3.7 Billion Steel Production Facility. Bob Hess Cushman & Wakefield Global Business Consulting. Topics. Introduction to Cushman & Wakefield Global Consulting Project Compass + New Star strategy and specifications

E N D
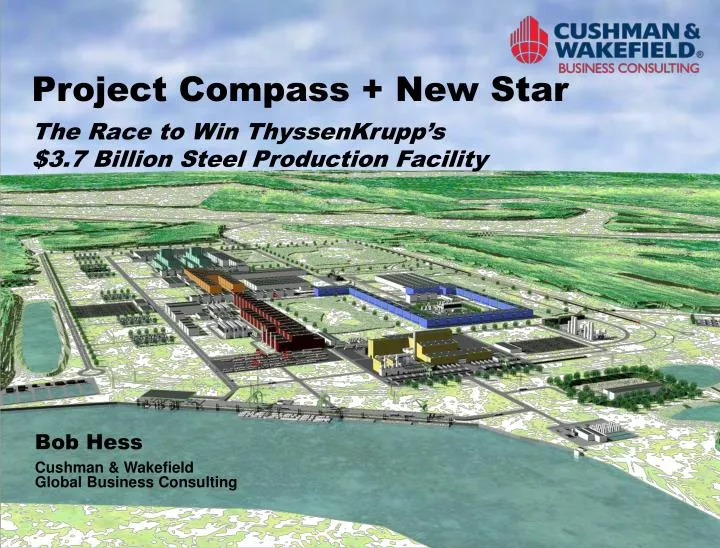
Project Compass + New StarThe Race to Win ThyssenKrupp’s $3.7 Billion Steel Production Facility Bob Hess Cushman & Wakefield Global Business Consulting
Topics • Introduction to Cushman & Wakefield Global Consulting • Project Compass + New Star strategy and specifications • Project evolution, site selection methodologies and results • Continue with ThyssenKrupp further Insights from: • Mr. Ernst Bernsdorf, Senior Vice President, ThyssenKrupp Stainless • Kai Mahnke, Vice President, ThyssenKrupp Steel USA
Cushman & Wakefield Overview • $1.5 billion revenues in 2006 • 12,000+ employees worldwide • World’s largest privately-held real estate services firm. Clients
Cushman & Wakefield Global Supply Chain Services Site Selection • Workforce • Business Climate • Op. Costs & Risk Site Constructability & Due Diligence Building Developer or Contractor Market Access and FDI Transportation Planning Manufacturing Facility Design Business Strategy & Goals Global Regional Local Implementation Supply Chain Strategy Contractor Vendor Selection Network Modeling & Simulation Environmental & Permitting Expert Building Construction Port Strategies & Feasibility Trading & Supplier Dynamics Material Handling Technology Real Estate Strategy & Transaction Financial Analysis Business Case Support Strategy Real Estate Infrastructure Execution Consulting Engineering Operations
Project CompassMobile, Alabama Project HerkulesGermany Carbon steel processing and stainless steel production Increased carbon steel production / processing for German market Project CSABrazil New carbon slab production for NAFTA and EU Markets Strategic Importance of Compass Project Compass is integral to ThyssenKrupp’s global strategy to grow NAFTA market share and improve cost positions.
Project Compass Specifications: Redefining ‘HUGE’ • Facility: $3.7 billion; 3,600 acres; 7 million SF under roof • Annual steel production for two segments: • Carbon: Processing / coating 4.1 million metric tons flat carbon steel • Stainless: 1 metric ton melt shop; then coiled and rolled • Employment : 2,700+ employees; 75% semi- or highly skilled • Utilities: • Electric: 10+ GVA Short Circuit Capacity; two 230-kV trans. lines; 300 MW service; 107,000 MWH/month • Natural gas: 1.2 million MCF per month • Water supply: 10 million gallons per day • Transportation / Access • Rail -- unit trains; Barge -- accessible (and reliable) inland waterway; • Port -- accessible for slab unloading; Highways – heavy duty! We began the project wondering: “Will ANY site meet these specs?”
Top Priority: Supply Chain Efficiency Logistics costs comprise 50% of Project Compass’ annual costs. Inbound Supply Chain: Louisiana Slabs: 4.1 MMT via Panamax Ship Unload Barge at Mill Unload Slabs to Port (Mill) Load Slabs to River Barge Origins: Brazil/Other Barge Inbound Supply Chain: Alabama OR OR Stocking Point or Customer Truck Coil Barge Rail Outbound Supply Chain
Leading and Managing the Experience • Unique aspects and key challenges of Project Compass/New Star: • Accelerate…accelerate….accelerate (to accept slabs from Brazil)…deadlines; • Diverse subject matter and large teams (market access, logistics, labor, financials, site development, permit applications); • Over 100 team members on project – numerous sub-teams around value chain of project with different leadership/management styles and needs. • High profile, with political and PR issues from day 1 – internal and external communication plans were key to success; • Time difference / travel / 7 x 24 expectations (no sleep, no vacations, no mercy!); • Magnitude – normal measures, methods, inquiries, models, etc. don’t necessarily apply • This was the “mother load” project that no one could respond to with off-the-shelf information; • Coaching states, utilities, chambers, railroads, ports, politicians, and other stakeholders to “think unconventionally” and to make the investments to compete; and • Team motivation, skillsets, and project expansion. …all worth it for a once in a lifetime project!
Search Area Four factors determined the search area: coastal port(s) for inbound slabs, barge-navigable water ways; anticipated customer concentrations; and business climate. Customer concentrations PA IL IN OH MD WV MO KY VA NC TN OK AR SC MS GA AL LA TX Inbound Slabs Inbound Slabs
Identifying and Eliminating Sites 1. 2. Request for Information (RFI) and sites issued to search-area states. RFI responses received and catalogued. 3. 4. Site inspections and community/utilities meetings used to select Preferred Sites. Sites evaluated against Critical Success Factors, and classified as Retain, Marginal or Eliminate.
Early Phases: Eliminating Sites and Ports The project initially progressed through phases of parallel analysis of candidate sites and ports on both the East and Gulf coasts. Sites 67 considered Ports 25 considered • Site Criteria • Electric infrastructure • Size / shape • Water and rail access • Natural gas service • Topography, wetlands, floodplains • Water supply • Layout challenges Port Criteria • Channel depth • Distance from open sea • Rail service • Berth length • Storage space • Inland river access • Qualified labor • Steel experience Desktop Flaws Analysis Sites 35 eliminated Ports 19 eliminated Site Visits Sites 20 eliminated Ports Terminals studied 12 sites / 6 ports
PA OH IN IL MD WV Philadelphia Baltimore MO KY VA NC TN OK AR Norfolk SC GA Morehead City AL MS LA TX PORTS FL Feasible (6) Mobile New Orleans Eliminated (19) SCALE equals 250 km Port Screening Methodology • Of the 25 ports analyzed for their ability to meet key Compass/New Star requirements, six appeared to present feasible options based on evaluations to date, eventually narrowed to Mobile and New Orleans. Ports Analyzed • Mobile, AL • Tampa, FL • Brunswick, GA • Savannah, GA • Burns Harbor, IN • Lake Charles, LA • Baton Rouge, LA • South Louisiana, LA • New Orleans, LA • Plaquemines, LA • Baltimore, MD • Gulfport, MS • Pascagoula, MS • New York, NY • Morehead City, NC • Cleveland, OH • Philadelphia, PA • Charleston, SC • Corpus Christi, TX • Port Lavaca, TX • Freeport, TX • Houston, TX • Beaumont, TX • Port Arthur, TX • Norfolk, VA
Critical Location Factors Throughout the project, candidate locations/sites were evaluated based on their performance against seven Critical Success Factors and their cost profile (20-year net present value). Utility Infrastructure 5.0% Quality of Life 3.0% 20-Year Total Costs (one-time and recurring) 50.0% Skilled Labor Availability & Quality 12.0% Business Climate Perceptions 7.0% Site Suitability & Quality 3.0% Ease of Implementation and Timing 7.5% % denotes decision weight Supply Chain Effectiveness 12.5%
Complete Business Case Evaluation Cushman & Wakefield and ThyssenKrupp developed working teams and methodologies to deploy a holistic business-case approach to identify the optimal location solution for Project Compass. Methodologies / Teams Optimal Location Solution Network/Logistics Modeling Port and Location Strategies Site Selection/Due Diligence Business Case Development Optimal Solution Workforce Profiling and Financial Modeling Incentive & Real Estate Negotiations Program Management Oversight
Selecting 3 Finalists from 12 Preferred Sites In three months of analysis and site visits, the 12 Preferred Sites were narrowed to three Finalists (Arkansas, Louisiana, and Alabama). 12 Sites in 7 States Qualitativeconditions ratings …ThyssenKrupp Stainless joins project - a ~$1 billion expansion!!… Multiple executive site and port tours Logistics network modeling Finalists: Further Due Diligence & Incentives Iterative business case and IRR modeling Illustrative examples
Extensive Due Diligence on Three Finalists Extensive financial and logistics modeling, coupled with engineering and site constructability analysis, revealed Alabama and Louisiana sites as superior candidates. Key Learnings • Highest logistics costs at Osceola, AR site • Louisiana site has the most manufacturing skills, but with premium costs • Construction and permitting challenges exist at all sites, but are manageable • Incentives dialog focused on needs to achieve ‘ready to build’ site Refined Logistics Modeling Greater site-specificity on modes, carriers, rates, and distribution models Labor Market Analysis Manufacturing industry presence, market-based wages, and education and training resources Site Constructability / Permitting Analyses Site-specific facility design, site prep cost estimation, and site conditions assessments Incentives Negotiations Incentives potential assessments, in-person meetings and Requests for Proposal
Tailoring Financial Incentives to the Sites • The final months of activity focused on development-cost estimation, environmental permitting, and problem solving through collaboration between ThyssenKrupp’s and the states’ teams… • … and tailoring incentive programs that could most impact the Project Compass/New Star business case. Financial Incentives • Prioritized based on business case impacts • Means to address extraordinary development needs (piling, grading, utility and transportation infrastructure) Facility Design and Site Development Costing • Site specific facility designs were refined based on results of on-going site assessments • Parallel wetlands, river construction and air permitting
Final Site Selection Decision The good news: Two great sites... The bad news: How do we decide?… • Based on the Critical Success Factors, the sites were objectively rated on 30+ weighted qualitative factors. • The results suggested a near tie based on qualitative factors. Unique pros and cons of the sites were nearly balanced. 30+ individually weighted factors re: operating conditions, risks, timing, etc. Illustrative examples
Final Site Selection Decision (continued) • Ultimately, ThyssenKrupp’s internal deliberations on the sites’ merits and their long-term financial business cases yielded the selection of the Mount Vernon, Alabama site. • Louisiana Highlights: Superior inbound logistics coupled with larger labor force and deeper manufacturing presence; yet more extensive infrastructure development and higher anticipated operating costs. • Alabama Highlights: Lower long-term operating costs (e.g., electricity and labor) and less complex site development and infrastructure-improvement scenario. • The final choice between the two sites was a very challenging one for ThyssenKrupp’s leadership and project teams – due in large part to the outstanding efforts of Team Louisiana and Team Alabama. • Intangibles and the performance of economic development teams played a key role in ThyssenKrupp’s decision-making throughout the project.