Download
1 / 32
460 likes | 1.1k Views
SURVEY DESIGN Define objectives & desired analyses Define target population Select sampling frame Choose sampling design, analysis approach Choose data collection method PREPARATION Create sampling frame Select sample Develop questions or measurements

E N D
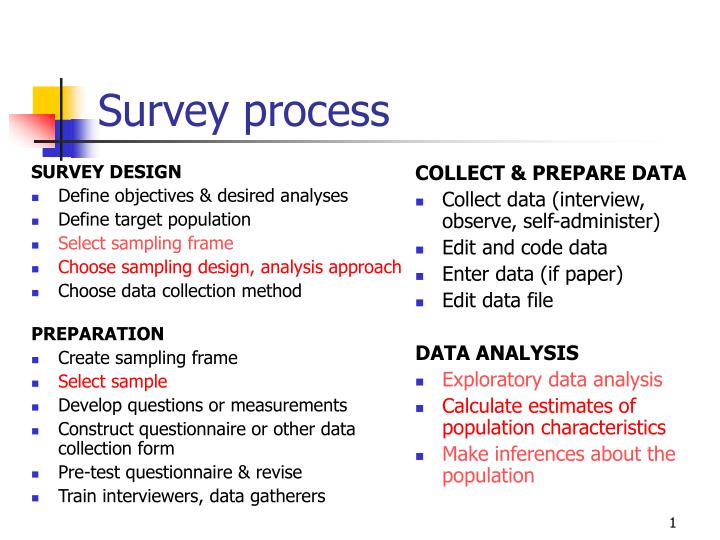
SURVEY DESIGN Define objectives & desired analyses Define target population Select sampling frame Choose sampling design, analysis approach Choose data collection method PREPARATION Create sampling frame Select sample Develop questions or measurements Construct questionnaire or other data collection form Pre-test questionnaire & revise Train interviewers, data gatherers COLLECT & PREPARE DATA Collect data (interview, observe, self-administer) Edit and code data Enter data (if paper) Edit data file DATA ANALYSIS Exploratory data analysis Calculate estimates of population characteristics Make inferences about the population Survey process
Design for sample surveys • Survey design involves selecting methods for all phases of the survey process, including sampling and estimation • Sample design driven by • Objectives • Type of measurements to be taken (questions, field observations) • Operational constraints ($, time, people, materials) • Analysis approach driven by • Objectives • Sample design (like design of experiments) • Data collected during the survey
Survey statistics • Study population • Finite number of units • 1.7 million people in Nebraska • 18,567 students at UNL • 3000 counties in the US • 400 accounts being audited in a private firm • Finite # of values discrete distribution
Survey statistics - 2 • Design • Very similar design structures • More explicit consideration of resource constraints and analysis objectives than in experimental design • Use stratification to obtain sufficient sample sizes for subpopulations • Use cluster sampling to reduce costs of collecting data
Survey statistics - 3 • Design-based estimation (this class) • Focus on estimating descriptive parameters: means, proportions, totals • Less emphasis on regression, etc. • Based on randomization theory • Other approaches exist • Model-assisted (cover this a bit) • Model-based (not covered)
Definitions • Observation unit (OU) • Individual (student, animal, female), household, land area, business, commercial account • May have more than one OU (cluster sampling later in semester) • Target population • Students at UNL, US households, farms, forests • Impacts survey design and inferences that can be made from survey • Can be hard to define • Political poll: are we interested in registered voters, voters in last election, eligible voters?
Definitions - 2 • Sample • Any method of selection (probability, quota, volunteer) • We will focus on ways of selecting a sample that use probability sampling • Sampling unit (SU) • May not be the same as the OU • Cluster sampling • OU = individual, SU = household • OU = elementary student, SU = school
Definition - 3 • Sampling frame • Want this to at least include the entire target population • Some parts of frame may be outside the target population • Randomly selected telephone numbers include non-working numbers that do not correspond to households • Sampled population – set of all possible OUs that might have been chosen in a sample, or population from which sample is selected • Ideally very close to target population • Does not include portions of target population that were • not sampled • sampled but failed to respond
Telephone survey of likely voters (Fig 1.1, p. 4) • OU • Target pop • SU • Frame • Sampled population = ?
National Crime Victimization Survey (NCVS) • Ongoing survey to study crime rates • Interested in total number of US households that were victimized by crime last year • OU • Target population • Sampling frame • Sampled population
Pesticide survey • Survey of nitrate and pesticide contamination in US drinking water • Target population • OU • Sampled population
What do we know about Hite’s study? • OU • Target population • SU • Sampling frame • Sampled population
Selection bias • Occurs when some part of the target population is not in the sampled population • May be due to ... • Sampling process • Data collection process • Can induce bias in estimated population parameters • Bias occurs when the omitted part of target population is different from the sampled population with respect to the analysis variables
Types of selection bias(Things you should avoid) • Convenience, volunteer samples • Take whomever is willing • Volunteer web surveys • Call-in surveys from TV programs • Judgment, purposive, quota samples • Select OUs without a probability mechanism • Pick sample using your judgment to reflect the target population composition • Find a point on the land that “represents” a “typical” soil condition • Mall intercept surveys may have a quota scheme • May be useful for initial studies to probe a topic • CANNOT make inferences about a population from such studies
Types of selection bias - 2(Things you should avoid) • Ad hoc substitution of observation unit • If respondent not home, go to (unselected) neighbor • Characteristics of substitute are likely to vary, may alter sample composition
Types of selection bias - 3 (Things you can partially control) • Undercoverage – sampling frame omits portion of target population • Homeless in telephone survey of U.S. residents • Unmapped waterways when sampling from USGS topographic maps • Remedies • Select / construct sampling frame carefully • Cover as much of the target population as possible • Better if portion not covered by frame is small, or if it differs in a way that minimizes impact on inferences • Once you have a frame, use probability sampling • Key to avoiding problems associated with convenience and purposive samples
Types of selection bias - 4(Things you can partially control) • Nonresponse during measurement process • Refusals • Unit (refuse participation in survey) • Item (refuse to answer a question) • Not reachable • Can’t locate sampled person due to outdated contact info • Incompetent • Too ill to complete survey, mentally/physically disabled • Remedies • Use multiple and persistent methods to find / reach OU • Variety of address sources (web, change-of-address) • Multiple attempts to call at different times of week / day • Use rigorous methods encourage OU to participate • Refusal conversion techniques, incentives, rapport (see later)
1936 Literary Digest survey • Predicted correctly presidential election outcome 1912-1932 • 1932: Predicted Roosevelt w/ 56%, got 58% in election • Used “commercial sampling methods” used to market books • Telephone books, club rosters, city directories, registered voter lists, mail-order lists, auto registrations • Mailed out 10 million questionnaires, received 2.3 million • 1936 • Predicted Roosevelt loss (41% to Landon’s 55%) • Roosevelt won, 61% to 37%
What happened? • Undercoverage in sampling frame • Heavy reliance on auto and phone lists • Those w/ cars and/or phones voted in favor or Roosevelt, but not to the extent that those without cars and phones did • Low response rate • Those responding preferred Landon relative to those who didin’t • Many Roosevelt supporters didn’t remember receiving survey • Large sample is no guarantee of accuracy
Selection bias nearly always exists • Want sample and resulting survey data to be “representative” of the target population • Good survey design and proper implementation of protocols are key to minimizing selection bias • Methods should be described in documentation and published articles • Enable user/reader to make judgments about the nature of selection bias and its effects on the interpretation of results • Useful to explicitly define the sampled population to reflect selection bias that has occurred in the survey process • Likely voters with telephones who could be reached and were willing and able to respond to the survey
Measurement bias • Ideally, want accurate responses to questions or measurements of phenomena • Measurement bias occurs when measurement process produces observations on an OU that differ from the true value for the OU in a systematic manner • Calibration error in scale adds 5 kg to weight for each person in a health survey • Bird surveys record species heard or sighted in 0.5 km radius during a 10 min period • Fail to present a valid option in a response list
Measurement bias in people • Respondent may provide false information • More likely with sensitive subject matter • Socially acceptable behavior (drug use) • Desire to influence outcome of survey to reap benefit (ag yields) • Memory • Recall bias – distant memory more prone to error • Telescoping – recall events that occurred before reference period
Measurement bias in people - 2 • Impact of interviewer • Respondent reactions • Caucasians provide different answers to white and black interviewers, vice versa • Interviewer interaction with respondent • Misreading questions • Poor rapport
Measurement bias in people - 3 • Impact of questionnaire • Respondent fails to understand question • May not understand terms, be confused by question, not hear correctly • Variation in interpretation of of words or phrases • Even simple questions may not be explicitly clear • Do you own a car? • Is “you” singular or plural? • Is a van or truck included in the concept of a car? • Question order • Context effects – previous question impacts answer • Poorly organized questionnaire can make it difficult for respondent to understand questions
Questionnaire design • Clearly and specifically define study objectives • Specific topics and questions for study • Identify target (sub)populations and contextual variables for analysis (e.g., demographics) • Evaluate proposed questions as to whether they clearly support objectives and analysis methods • Pre-test the survey instrument (=questionnaire) • On respondents from the target population • Large-scale surveys may rely on intensive study • NCVS: alternative recall periods, question wording
Writing questions • Use clear, simple, precise language • Focus on one well-defined item in a question • Avoid referring to multiple concepts in a single question • Divide lengthy questions into a contextual statement plus a simple question • Specify a time frame, area, or other form of scope • Define critical terms • State question neutrally • Avoid leading questions that might induce bias
Writing questions - 2 • Response formats • Use mutually-exclusive categories in closed-ended questions • Reduce post-hoc coding by minimizing use of open-ended questions • Organization • Group questions to improve ability of respondent to follow content and understand questions • Put key questions first while the respondent is fresh (but start easy)
Impact of measurement bias • Measurement bias via data collection procedures • Individual observation level • Bias at the observation level impacts estimates in two ways • Systematic bias over OUs in sample in same direction results in a biased estimate of a population characteristic • Measurement error often results in increased variance in estimates (with or without bias) as well
Nonsampling Errors(Lessler & Kalsbeek, 1992) • Assume: probability sample • Frame error • Mismatch between sampled population & target population • Nonresponse error • Unable to obtain data from observation units • Whole observation unit or single response item • Measurement error • Inadequacies in the process of obtaining measurements from observation units
Survey error model Total Survey Error = + Due to the sampling process (i.e., we observe only part of population) Measurement errorNonresponse errorFrame error Assessed via bias and variance
Sampling Error • Sample survey • Collecting data from a sample – a subset of the population – to make inference about the whole population • We never observe the whole population estimate for any one sample is unlikely to perfectly match the population parameter • Example • Proportion of undergraduates in Fall 2000 that are males = 44.6% • Select a sample of 100 undergrads estimate = 46.2% • Select a sample of 100 undergrads estimate is 41.9% • Etc.
Why sample? • Widely accepted that sample surveys of large populations will lead to more precise estimates than a census of the population • Sampling error vanishes, but measurement error is typically much higher • US example • Number of occupied housing units (N) = 105,480,101 • Federal statistical survey sample size (n) = 50,000 • May not be a need to select a sample with small populations (e.g., web or mail surveys) • Membership of organizations • Employees in a business