Download
1 / 34
340 likes | 457 Views
Linear Regression Models. Andy Wang CIS 5930-03 Computer Systems Performance Analysis. Linear Regression Models. What is a (good) model? Estimating model parameters Allocating variation Confidence intervals for regressions Verifying assumptions visually. What Is a (Good) Model?.

E N D
Linear Regression Models Andy Wang CIS 5930-03 Computer Systems Performance Analysis
Linear Regression Models • What is a (good) model? • Estimating model parameters • Allocating variation • Confidence intervals for regressions • Verifying assumptions visually
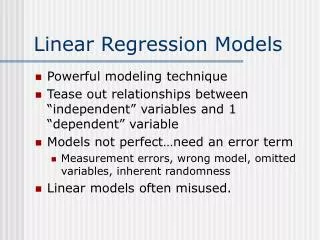
What Is a (Good) Model? • For correlated data, model predicts response given an input • Model should be equation that fits data • Standard definition of “fits” is least-squares • Minimize squared error • Keep mean error zero • Minimizes variance of errors
Least-Squared Error • If then error in estimate for xi is • Minimize Sum of Squared Errors (SSE) • Subject to the constraint
Estimating Model Parameters • Best regression parameters are where • Note error in book!
Parameter EstimationExample • Execution time of a script for various loop counts: • = 6.8, = 2.32, xy = 88.7, x2 = 264 • b0 = 2.32 (0.30)(6.8) = 0.28
Allocating Variation • If no regression, best guess of y is • Observed values of y differ from , giving rise to errors (variance) • Regression gives better guess, but there are still errors • We can evaluate quality of regression by allocating sources of errors
The Total Sum of Squares • Without regression, squared error is
The Sum of Squaresfrom Regression • Recall that regression error is • Error without regression is SST • So regression explains SSR = SST - SSE • Regression quality measured by coefficient of determination
Evaluating Coefficientof Determination • Compute • Compute • Compute • where R = R(x,y) = correlation(x,y)
Example of Coefficientof Determination • For previous regression example • y = 11.60, y2 = 29.88, xy = 88.7, • SSE = 29.88-(0.28)(11.60)-(0.30)(88.7) = 0.028 • SST = 29.88-26.9 = 2.97 • SSR = 2.97-.03 = 2.94 • R2 = (2.97-0.03)/2.97 = 0.99
Standard Deviationof Errors • Variance of errors is SSE divided by degrees of freedom • DOF is n2 because we’ve calculated 2 regression parameters from the data • So variance (mean squared error, MSE) is SSE/(n2) • Standard dev. of errors is square root: (minor error in book)
Checking Degreesof Freedom • Degrees of freedom always equate: • SS0 has 1 (computed from ) • SST has n1 (computed from data and , which uses up 1) • SSE has n2 (needs 2 regression parameters) • So
Example ofStandard Deviation of Errors • For regression example, SSE was 0.03, so MSE is 0.03/3 = 0.01 and se = 0.10 • Note high quality of our regression: • R2 = 0.99 • se = 0.10
Confidence Intervals for Regressions • Regression is done from a single population sample (size n) • Different sample might give different results • True model is y = 0 + 1x • Parameters b0 and b1 are really means taken from a population sample
Calculating Intervalsfor Regression Parameters • Standard deviations of parameters: • Confidence intervals arewhere t has n - 2 degrees of freedom • Not divided by sqrt(n)
Example of Regression Confidence Intervals • Recall se = 0.13, n = 5, x2 = 264, = 6.8 • So • Using 90% confidence level, t0.95;3 = 2.353
Regression Confidence Example, cont’d • Thus, b0 interval is • Not significant at 90% • And b1 is • Significant at 90% (and would survive even 99.9% test)
Confidence Intervalsfor Predictions • Previous confidence intervals are for parameters • How certain can we be that the parameters are correct? • Purpose of regression is prediction • How accurate are the predictions? • Regression gives mean of predicted response, based on sample we took
Predicting m Samples • Standard deviation for mean of future sample of m observations at xpis • Note deviation drops as m • Variance minimal at x = • Use t-quantiles with n–2 DOF for interval
Example of Confidenceof Predictions • Using previous equation, what is predicted time for a single run of 8 loops? • Time = 0.28 + 0.30(8) = 2.68 • Standard deviation of errors se = 0.10 • 90% interval is then
Verifying Assumptions Visually • Regressions are based on assumptions: • Linear relationship between response y and predictor x • Or nonlinear relationship used in fitting • Predictor x nonstochastic and error-free • Model errors statistically independent • With distribution N(0,c) for constant c • If assumptions violated, model misleading or invalid
Testing Linearity • Scatter plot x vs. y to see basic curve type Linear Piecewise Linear Outlier Nonlinear (Power)
TestingIndependence of Errors • Scatter-plot i versus • Should be no visible trend • Example from our curve fit:
More on Testing Independence • May be useful to plot error residuals versus experiment number • In previous example, this gives same plot except for x scaling • No foolproof tests • “Independence” test really disproves particular dependence • Maybe next test will show different dependence
Testing for Normal Errors • Prepare quantile-quantile plot of errors • Example for our regression:
Testing for Constant Standard Deviation • Tongue-twister: homoscedasticity • Return to independence plot • Look for trend in spread • Example:
Linear RegressionCan Be Misleading • Regression throws away some information about the data • To allow more compact summarization • Sometimes vital characteristics are thrown away • Often, looking at data plots can tell you whether you will have a problem
Example ofMisleading Regression I II III IV x y x y x y x y 10 8.04 10 9.14 10 7.46 8 6.58 8 6.95 8 8.14 8 6.77 8 5.76 13 7.58 13 8.74 13 12.74 8 7.71 9 8.81 9 8.77 9 7.11 8 8.84 11 8.33 11 9.26 11 7.81 8 8.47 14 9.96 14 8.10 14 8.84 8 7.04 6 7.24 6 6.13 6 6.08 8 5.25 4 4.26 4 3.10 4 5.39 19 12.50 12 10.84 12 9.13 12 8.15 8 5.56 7 4.82 7 7.26 7 6.42 8 7.91 5 5.68 5 4.74 5 5.73 8 6.89
What Does Regression Tell Us About These Data Sets? • Exactly the same thing for each! • N = 11 • Mean of y = 7.5 • Y = 3 + .5 X • Standard error of regression is 0.118 • All the sums of squares are the same • Correlation coefficient = .82 • R2 = .67
Now Look at the Data Plots I II III IV