Download

1 / 18
180 likes | 279 Views
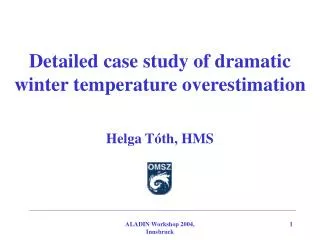
Interesting Temperature Field Structure during the SOLVE-2/VINTERSOL Winter. MJ Mahoney & Bruce Gary Jet Propulsion Laboratory California Institute of Technology Pasadena, CA SOLVE2/VINTERSOL Meeting October 21-24, 2003 Orlando, FL. Abstract

E N D
Interesting Temperature Field Structure during the SOLVE-2/VINTERSOL Winter MJ Mahoney & Bruce Gary Jet Propulsion Laboratory California Institute of Technology Pasadena, CA SOLVE2/VINTERSOL Meeting October 21-24, 2003 Orlando, FL
Abstract Comparisons of the JPL Microwave Temperature Profiler (MTP) data with synoptic scale temperature fields from the GSFC Global Model-ing and Assimilation Office (GMAO) assimilation model interpolated to flight level sometimes show very substantial differences (>10 K). Not surprisingly, these differences are most often largest when the DC-8 is far from radiosonde launch sites. For all the DC-8 flights,the average bias of the GMAO temperatures was -1.04 K, with a pop-ulation standard error of - 1.46 K. This was the same result that we found during the first SOLVE campaign. The MTP measurements will be important for understanding the impact of mesoscale temperature structure on satellite retrievals, especially when entering or leaving the vortex. There were many occasions during the SOLVE-2 campaign when stratospheric intrusions were observed with interesting isentrope behaviour. Several examples of such structure will be presented. We will also discuss gravity wave activity during the campaign.
Figure 1. A comparison of GMAO (blue) and MTP (red) flight level temperatures. Near the vortex edge there is substantial mesoscale structure which the model cannot capture.
Figure 1 shows an example of the mesoscale temperature fluctuations during the DC-8 flight of 2003.01.16. The blue trace is the GMAO 1° x 1° grid data interpolated to the DC-8 flight level, and the red trace is the MTP flight level temperature (Tmtp) -- both on the left hand ordinate axis. The green trace is the difference between these two data sets, Tmtp - Tgmao, and it is plotted on the right hand ordinate axis. Also indicated on the plot are orange triangles, which indicate when the DC-8 came close to a radiosonde launch site. Since the GMAO re-analysis uses radiosondes as part of it's input data set, it would be expected that there would be better agreement with Tmtp at these times, which is often the case. During this flight peak-to-peak temperatures differences in excess of 10 K are seen. Figure 2 shows temperature difference statistics for the 11 DC-8 flights based out of Kiruna, Sweden. There is a cold bias of 1.04 K on average for these flights, with a population standard deviation on the average of 1.46 K. This is very similar to the result that we found for the first SOLVE campaign [ Tgmao = Tmtp - (0.91 1.96) K]. Different models were used for each of the campaigns.
Figure 2. For the 11 flights from Kiruna, Tgmao = Tmtp - (1.04 +/- 1.46) K
GSFC Temperature & Trop at 250 hPa (10.4 km) 44 ks An Example of Strat-Trop Exchange On the DC-8 flight of 2003.01.14 there were two periods when the aircraft began to exit the vortex. The following two slides focus on the period from 40 to 48 ks UT. The flight segment from 43-45 ks UT is indicated in red on the four images on this slide. GSFC Potential Vorticity at 450 K (~19.5 km) Figure 3 GSFC Potential Vorticity at 380 K (~15 km)
40.0 ks 42.5 ks 44.0 ks 45.5 ks 48.0 ks =295K to 370K every 5K DIAL nadir O3 from the surface (black line below) to ~9.5 km pressure altitude. Figure 4
There were many occasions during the DC-8 SOLVE-2 flights when the vortex edge was approached and MTP-derived stratospheric isentropes cut across the tropopause and dipped several kilometers into the troposphere. This occurred twice during the flight of 2003.01.14. Figure 3 and 4 show the second of these edge encounters. The closest approach to the vortex edge occurred at ~44 ks UT, when the DC-8 heading changed from W to NE. As would be expected, the wind speed increased to a maximum value of ~110 knots as the vortex edge was approached (red trace with units on right hand ordinate scale). Figure 4 shows the MTP-derived isentropes dropping several kilometers, consistent with the LaRC DIAL ozone isopleths shown at the bottom of the figure. The MTP tropopause is indicated by pink triangles, and the theta surfaces range from 295 K to 370 K in 5 K steps. This stratospheric intrusion teaches us some lessons. The five temperature profiles across the top of Figure 4 show how the MTP tropopause weakened at 42.5 ks and 45.5 ks compared to deeper inside the vortex; they also show a “false” tropopause at 44.0 ks which is ~1 km higher than inside the vortex, and several kilometers higher than the chemical tropopause represented by the LaRC DIAL measurements at the bottom of the figure.
GSFC Temperature & Trop at 250 hPa (10.4 km) Vortex Edge Tracer Variability The flight of 2003.01.16 provides several examples of stratospheric tracers which appear to be mixed with tropospheric air when the DC-8 was well above the tropopause. The following two slides focus on the period from 57 to 62 ks UT. The flight segment from 58-60 ks UT is indicated in blue on the three images to the left. GSFC Potential Vorticity at 450 K (~19.5 km) Figure 5 GSFC Potential Vorticity at 380 K (~15 km)
57.5 ks 58.5 ks 59.5 ks 60.5 ks 61.5 ks WAVE Figure 6. An example of strong vertical divergence of isentropes in the troposphere and con-vergence in the stratosphere. The light blue isentropes range from 300-350 K in 5 K steps.
As on the flight of 2003.01.14, the flight of 2003.01.16 shows very dynamic isentrope behaviour from 57-62 ks. This case is perhaps more dramatic than the previous flight. The tropopause begins this flight segment on the 315 K isentrope and then moves up to the 320 K isentrope at 58.4 ks. At the same time, the 315 K isentrope dramatically drops 2 km. This vertical divergence of the isentropes im-mediately below the tropopause is similar to what is seen is lee waves, and must in some way be related to the dynamics near the vortex edge. It is also apparent that the isentropes immediately above the tropopause are squished together. Unlike the previous flight, the temperature profiles show that the tropopause never gets “soft.” In fact just the opposite is the case -- the tropopause develops a very strong inversion at 59.5 ks. This stability prevents the isentropes from crossing the tropopause. There was however a short period of time near 59.7 ks when the 320 K isentrope dropped below the tropopause, and at the same time the in situ ozone (purple) rose rapidly as an apparent wave dipped down to flight level. Just below the tropopause there's a full 2 cycles worth of isentrope displacement, and the amplitude is large. In the stratosphere the amplitude is lower, the opposite of mountain wave behavior. Figure 7 shows a theta/tracer plot for in situ ozone, and there appears to be three different regimes for ozone loss, which can be separated by latitude. This is shown on the map in Figure 5. (<66.8 º N=blue, 66.8-77 º N=orange, >77 º N=green)
Figure 7. The most depleted ozone (blue) appears at latitudes south of 66.8 º N. Since sunlight would be present above 11 km to 72.4 º N, this suggests that the ozone loss is due to either photochemistry or mixing with low-ozone air. The green points represent data taken deepest inside the vortex (see Figure 5 map). This ozone data (measured at different altitudes) shows significant ozone loss with respect to the rest of the vortex (orange). Since sunlight does not reach these latitudes, the loss must be due to mixing with air parcels transported from lower latitudes or the troposphere.
ENBO RAOBs in 2000 (above) & 2003 (below) BGBW RAOBs in 2000 (above) & 2003 (below) Figure 8. The two RAOB sites with the largest amplitude lee wave activity in 2000 & 2003
Gravity Wave Activity During SOLVE-2/VINTERSOL A companion poster discussed the EUPLEX flights on the Geophysica and compared gravity wave activity observed by the MTP with that predicted by the NRL Mountain Wave Forecast Model (MWFM). In general the wave activity was weak to moderate on all flights. During the first SOLVE campaign, the MTP observed on 2000.01.25 the largest amplitude lee wave we had ever seen. An examination of radiosonde data showed that during the SOLVE campaign there were only two periods of large lee wave amplitudes (>10 K). As shown in the upper panels of Figure 8, the Bodo, Norway, sondes (left, ENBO) of 01/25 at 12UT (pink) and 01/26 at 12UT (yellow) show that the lee wave persisted for at least 24 hrs. The Narsarssuaq, Greenland, sondes (right, BGBW) of 03/18 at 00UT (yellow) and 03/19 at 12UT (yellow) show that the lee wave there persisted for at least 36 hrs. The lower panels of Figure 8 show sonde data with large amplitude lee waves during the SOLVE-2 campaign. There were three periods of large amplitude lee wave activity, again at the same two sonde launch sites, which is typical of the last 6 winters. The bottom left panel shows the 12 UT sondes launched from Bodo on 01/16 (yellow) and 3/24 (pink). The bottom right panel shows two Narsarssuaq sondes launched on 01/31 at 12UT (yellow) and on 02/06 at 00UT. The 01/31 Narsarssuaq sonde is remarkable in both it’s growth with altitude, and its maximum amplitude. It’s the largest that we have ever seen. The vertical wavelengths of these waves is 5-8 km, which is typical.
Acknowledgements • This work was supported by Dr. Mike Kurylo of the NASA Upper Atmosphere Research Program. • We thank NASA GSFC Code 916 for the use of the potential vorticity and temperature fields. • We thank NRL for the MWFM 2.1 lee wave activity forecasts. • We thank LaRC Fastoz for in situ ozone data. • We thank LaRC DIAL for ozone curtain data. • This work was carried out at the Jet Propulsion Laboratory, California Institute of Technology, under a contract with the National Aeronautics and Space Administration.