Download
1 / 103
1.1k likes | 1.37k Views
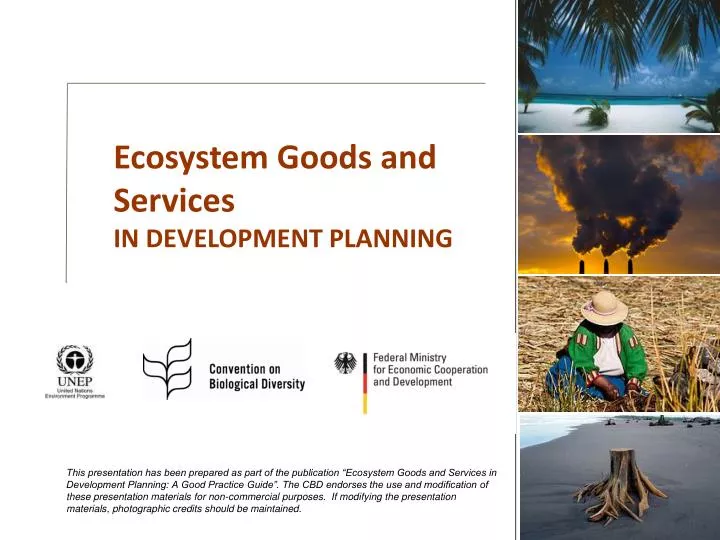
Ecosystem Goods and Services IN DEVELOPMENT PLANNING.

E N D
Ecosystem Goods and Services IN DEVELOPMENT PLANNING This presentation has been prepared as part of the publication “Ecosystem Goods and Services in Development Planning: A Good Practice Guide”. The CBD endorses the use and modification of these presentation materials for non-commercial purposes. If modifying the presentation materials, photographic credits should be maintained.
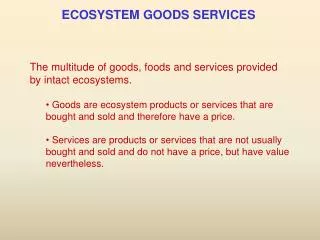
NOTE TO THE READER In this presentation, you are invited to navigate freely through some of the main components of policy and financial planning which highlight, capture and integrate Environmental Goods and Services (EGS). By definition, ecosystem goods and services represent the benefits that humans derive from naturally functioning ecological systems. Source: Costanza et. al., 1997
Please select one of the following two navigational tools. You may prefer to view the slides either through a linear or a systematic approach. SYSTEMIC OUTLINE LINEAR OUTLINE
OUTLINE ENVIRONMENTAL CONCEPTS • Demystifying the Environmental Jargon • Ecosystem Goods & Services in Development DEVELOPMENT PLANNING • Building Governance and Vision • Assessment and Valuation of EGS • Integrative and EGS Inclusive Planning BUDGETING AND FINANCIAL PLANNING • Budgeting and Financial Planning Background • Environmental Fiscal Reform • Innovative Environmental Finance Architecture • Medium Term Expenditure Framework ADAPTIVE PLANNING AND KNOWLEDGE MANAGEMENT • Capacity Building and Awareness Raising • Policy and Budget Monitoring • Lessons Learned and Knowledge Sharing RESOURCES • References • Readings
Decentralizedplans Spatial plans Sector Plans Integrated EGS Systemic Model in Policy and Financial Planning Click on selection Innovative Finance Mechanisms Assess & Value Ecosystem Goods & Services Secure environmental vision and governance Environmental Fiscal Reform Medium Term Expenditure Framework Monitor results, develop and share knowledge Demystifying “environmental jargon” EGS benefits feed into Sustainable Development & Poverty Reduction Strategies EGS in Development/ Poverty/ Disasters More info
Decentralized Plans Spatial Plans Sector Plans Integrated EGS Background Information Policy Planning Questions Financial Planning Questions Innovative Finance Mechanisms ? ? Assess & Value Ecosystem Goods & Services Secure environmental vision and governance Environmental Fiscal Reform Medium Term Expenditure Framework Readings Monitor results, develop and share knowledge ? Benefits Demystifying “environmental jargon” Case Studies ? EGS benefits feed into Sustainable Development & Poverty Reduction Strategies EGS in Development/ Poverty/ Disasters ? ? ? ? Benefits Challenges Benefits Facts
Decentralized Plans Spatial plans Sector Plans Integrated EGS Systemic Model in Policy and Financial Planning Innovative Finance Mechanisms Assess & Value Ecosystem Goods & Services Secure environmental vision and governance Environmental Fiscal Reform Medium Term Expenditure Framework Monitor results, develop and share knowledge Demystifying “environmental jargon” EGS benefits feed into Sustainable Development & Poverty Reduction Strategies EGS in Development/ Poverty/ Disasters More info
Common Beliefs About the Environment i Non-accessible environmental jargon and its consequences on planning : • It is too costly and can slow down development; • It is a secondary issue compared to socio-economic priorities; • It can only generate limited benefits ; • It is possible to mitigate environmental damage through modern technologies; • It is just about certain charismatic species and trees; • It is not always possible to have clear agreement on scientific issues concerning the environment; • It requires complicated measures of intervention to deal with some environmental issues. Demystifying “environmental jargon” BACK TO LINEAR OUTLINE BACK TO SYSTEMIC OUTLINE Slide 1/12
Why Demystify Environmental Jargon? i • Factor requiring demystification • Gap between scientific language and policy/financial planning; • Technical language barriers hinder the effective integration of environmental concepts in planning • Environment regarded often as a set of problems to be solved. • How to demystify? • Reducing language barriers; • Focusing on environmental benefits. Demystifying “environmental jargon” • Where to apply? • Environmental issues are the responsibility of all sectors . BACK TO LINEAR OUTLINE BACK TO SYSTEMIC OUTLINE Slide 2/12
Biodiversity and Ecosystems i Biological diversity (Biodiversity) is the variability among living organisms from all sources including, inter alia, terrestrial, marine and other aquatic ecosystems and the ecological complexes of which they are part; Each ecosystem contains complex relationships between living organisms (biodiversity) and non-living matter as well as the weather patterns that affect them. Ecosystems, Eco- from the Greek oîkos meaning house/‘habitat’ Demystifying “environmental jargon” BACK TO LINEAR OUTLINE BACK TO SYSTEMIC OUTLINE Slide 3/12
Humans, Biodiversity and Ecosystems i Development impacts ecosystem services Demystifying “environmental jargon” Ecosystem services sustain development Source: WRI 2008 BACK TO LINEAR OUTLINE BACK TO SYSTEMIC OUTLINE Slide 4/12
Common Look at Biodiversity and Ecosystems i Common Understanding Real Situation Wrong Correct Demystifying “environmental jargon” Human beings are part of biodiversity - they interact directly with all its elements at different geographical and temporal scales. Ecosystems provide vital services for human needs and development. They are found in a state of dynamic equilibrium, to which development can cause severe damages. BACK TO LINEAR OUTLINE BACK TO SYSTEMIC OUTLINE Slide 5/12
Impacts on Biodiversity & Ecosystems i Click for more facts Previous Next • 50% of the world’s wetlands have been lost in the past century; • 80 % of grasslands are suffering from soil degradation; • 20 % of dry lands are in the danger of becoming deserts; • Tropical forest shrinking at about 5 % per decade, adding 3 billion tons of CO2to the atmosphere yearly and contributing to major loss of biodiversity; • 90 % of all large fish species have disappeared from the oceans in the past half century; • Inland water species have declined by 50%; • Marine and terrestrial species have declined by approximately 30%; • 23% of mammals and 25% of conifers threatened with extinction; • 12% of bird species now threatened with extinction ; • 32% of amphibians are categorized as threatened with extinction; • Current atmospheric emissions of CO2 are nearly 400% emissions in 1950. Demystifying “environmental jargon” Source: JLG 2007 / SCBD 2006/ World Bank 2008/Worm, Lotze and Myers 2003 BACK TO LINEAR OUTLINE BACK TO SYSTEMIC OUTLINE Slide 6/12
Biodiversity and Ecosystem Goods and Services i >> Biodiversity and Ecosystem Goods and Services (EGS) • Ecosystems provide vital goods and services to humans; • EGS come in a bundled form; • Exploiting intensively one EGS can render others unavailable; • EGS can be tangible and non-tangible; • Some EGS can be renewable but run the risk of depletion; • A pressured ecosystem can collapse suddenly without pre-notice; • Neighboring ecosystems can be affected by changes occurring in any of them. Demystifying “environmental jargon” BACK TO LINEAR OUTLINE BACK TO SYSTEMIC OUTLINE Slide 7/12
Human Dependence on Biodiversity and Ecosystems i Click for more facts Previous Next • 20 to 120 million people live in areas affected by desertification; • 1.3 billionhuman beings live from agro-forestry resources; • 70%of world population relies on medicinal plants; • More than 3 billion people depend on marine and coastal biodiversity for their livelihoods; • 60 million indigenous people are almost wholly dependent on forests; • 350 millionpeople depend on forests for a high degree for subsistence and income; • About 33% of the world is living under moderate to severe water stress. Demystifying “environmental jargon” Source: JLG 2007 / SCBD 2006/ World Bank 2008 BACK TO LINEAR OUTLINE BACK TO SYSTEMIC OUTLINE Slide 8/12
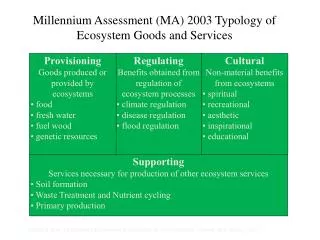
i Millennium Ecosystem Assessment (MA) >> Ecosystem Goods & Services • MA study >1200 experts over 3 years; • Published in 2005; • MA identified 4 categories of ecosystem services; • 24 services were studied and evaluated; • 16 services were found in decline. Demystifying “environmental jargon” (MA 2005) BACK TO LINEAR OUTLINE BACK TO SYSTEMIC OUTLINE Slide 9/12
Demystifying the environmental jargon i Click for more facts Previous Next >> Estimated Yearly Value of Ecosystem Services Global GNP 18 US$ Trillion Demystifying “environmental jargon” Global Ecosystem Services 33 US$ Trillion Source: R. Costanza et al. 1997 BACK TO LINEAR OUTLINE BACK TO SYSTEMIC OUTLINE Slide 10/12
Ecosystem Based Solutions vs Manmade Solutions i Demystifying “environmental jargon” Mainly Responsive Approach Mainly Pro-active Approach “Wetlands and forests can be up to 22 times more effective than investing in water treatment plants.” Christian Nellemann, UNEP BACK TO LINEAR OUTLINE BACK TO SYSTEMIC OUTLINE Slide 11/12
Click for more Case Studies Previous Next CASE STUDY Man-made Solutions vs Ecosystem Based Solutions(Uganda) Water treatment and purification - Nakivubowetland The wetland plays an extremely important role in maintaining the quality of the city’s water supply. Wetland plants can remove […] pollutants and pathogenic organisms in the wetland’s bottom. Demystifying “environmental jargon” Source: Emerton et al. 1998 BACK TO LINEAR OUTLINE BACK TO SYSTEMIC OUTLINE Slide 12/12
Decentralized Plans Spatial plans Sector Plans Integrated EGS Systemic Model in Policy and Financial Planning Innovative Finance Mechanisms Assess & Value Ecosystem Goods & Services Secure environmental vision and governance Environmental Fiscal Reform Medium Term Expenditure Framework Monitor results, develop and share knowledge Demystifying “environmental jargon” EGS benefits feed into Sustainable Development & Poverty Reduction Strategies EGS in Development/ Poverty/ Disasters More info
EGS in Development Sectors i • What are the inter-linkages, impacts and dependence of socio-economic sectors on ecosystem goods and services? • How can EGS contributeto development, through sustainable economic growth, poverty reduction and resilience to climate change and natural disasters? EGS in development sectors BACK TO LINEAR OUTLINE BACK TO SYSTEMIC OUTLINE Slide 1/12
Health Industry Other(business, infrastructure …) Agriculture Ecosystem goods and services and some development sectors i Benefits Impacts EGS in development sectors Development activities have various EGS impacts and needs: • Identify key EGS services; • Balance EGS distribution; • Reduce ecological footprint ; • Improve efficiency of sectoral consumption/usage of EGS. BACK TO LINEAR OUTLINE BACK TO SYSTEMIC OUTLINE Slide 2/12
Click for more Case Studies Previous Next CASE STUDY Man-made Solutions vs Ecosystem Based Solutions(USA) Catskill Mountains New York City spent $US1 billion restoring watersheds in the Catskill mountains–a significant savings compared to the $US8 billion to build a water filtration plant and $US300 to $US500 million per year to maintain it. EGS in development sectors Source: UNEP BACK TO LINEAR OUTLINE BACK TO SYSTEMIC OUTLINE Slide 3/12
EGS and Impacts of Sectors’ Development i Click for more facts Previous Next • 1.1 billion of the world population have no access to clean water; • Agricultural sector can represent up to 80%of a country’s waterconsumption; • The livestock sector generates more greenhouse gas emissions than the transport sector. (about 18 %of global GHG); • 13 million hectaresof the world’s forests are cut down and converted to other land uses every year ; • Deforestation and forest degradation are the 2nd cause of GHG; • Mining industry accelerates deforestation and releases toxic compounds (e.g. mercury, cyanide…) in neighboring ecosystems. EGS in development sectors Source: FAO n.d. BACK TO LINEAR OUTLINE BACK TO SYSTEMIC OUTLINE Slide 4/12
Economic Sector Dependence and Impacts on EGS i • The same EGS are often shared between multiple sectors and the broader population. (e.g. water, timber, medicinal plants…) ; • Sectors’ activities can impact ecosystems in different ways (negatively/positively) while having conflicting goals relative to the potential use of available EGS; • The degradation of one ecosystem can have both local and regional consequences on EGS availability. EGS in development sectors BACK TO LINEAR OUTLINE BACK TO SYSTEMIC OUTLINE Slide 5/12
Ecosystem goods and services and Global Loss of Seafood Species i Collapse of fish species by 2050, ocean can be empty under continuous unsustainable practices EGS in development sectors Source: FAO n.d. BACK TO LINEAR OUTLINE BACK TO SYSTEMIC OUTLINE Slide 6/12
Facts About EGS and Poverty i Click for more facts Previous Next • 75% of the 2.6 billionpeople who live on less than $2 a day are dependent upon local natural resources; • 75% of the poor live in rural areas and from agriculture but in marginalized or insufficient land or resources to meet their basic needs; • The rural poor, still depend on rivers and streams for their water; • The poor often rely on traditional medicines for many of their ailments; • One billion persons live in bamboo houses; • Significant differences between the roles and rights of men and women in many societies make women vulnerable to changes in EGS availability; • 20 % of the burden ofdiseases in developing countries can be attributed to ecological factors; • Direct and indirect costs from malaria consume approximately 33 % of household income of the poor. EGS and poverty Source: UNEP 2004, INBAR n.d., WRI in collaboration with UNDP/ UNEP and World Bank 2008 BACK TO LINEAR OUTLINE BACK TO SYSTEMIC OUTLINE Slide 7/12
Constituents and/or Determinants of Well-being i 10 constituents and/or determinants of well-being which are closely related with ecosystems (Duraiappah 2004) are: • Being able to be adequately nourished; • Being able to be free from avoidable disease; • Being able to live in an environmentally clean and safe shelter; • Being able to have adequate and clean drinking water; • Being able to have clean air; • Being able to have energy to keep warm and to cook; • Being able to use traditional medicine; • Being able to continue using natural elements found in ecosystems for traditional cultural and spiritual practices; • Being able to cope with extreme natural events including floods, tropical storms and landslides; • Being able to make sustainable management decisions that respect natural resources and enable the achievement of a sustainable income stream. EGS and poverty BACK TO LINEAR OUTLINE BACK TO SYSTEMIC OUTLINE Slide 8/12
Poor’s Vulnerability to Environmental Change i • The poor rely on ecosystem goods and services for a range of basic needs (food, shelter, clothing, medicine, energy, income...); • As demand for ecosystem services has grown, it is particularly poor people that have lost access and their rights to these resources due to privatization; • Poor are particularly vulnerable to environmental change; • Reliance of rural poor on ecosystem services is rarely measured and thus typically overlooked in assessments and poverty reduction strategies. EGS and poverty Source: Comim 2008 BACK TO LINEAR OUTLINE BACK TO SYSTEMIC OUTLINE Slide 9/12
EGS and the Millennium Development Goals (MDG) i EGS and poverty BACK TO LINEAR OUTLINE BACK TO SYSTEMIC OUTLINE Slide 10/12
EGS Climate Change and Natural Disasters i Click for more facts Previous Next • In the last 10 years, economic losses from natural disasters have averaged about $ 40 billion a year; • Between 1990 and 1998, 94 % of the world’s major disasters were in developing countries ; • 24 of the 49 least developed countries face a high-level of disaster risk; • Global costs of natural disasters will rise by 500% over the next 50 years; • By 2050, more than 200 million people could be rendered homeless by rising sea levels, floods and drought; • By 2050 agriculturalyields in some countries could be reduced by as much as 50%; • Women constitute up to 80% of refugee and displaced populations worldwide, and in emergency situations women and children may typically make up 70 to 80% of those needing assistance. EGS Climate Change and natural disasters Source: ECOSOC 2008, IUCN and World Bank 2008 BACK TO LINEAR OUTLINE BACK TO SYSTEMIC OUTLINE Slide 11/12
Ecosystem Resilience Climate Change and Natural Disasters i • There are 5 reasons to integrate ecosystem-based management in disaster risk reduction and development planning: • It can decrease vulnerability to natural disasters ; • Natural disasters have a high cost; • It costs less to prevent disasters than it does to fix the damage they cause ; • At-risk populations depend on ecosystems for their livelihoods; • Natural disasters and the responses to them have a negative impact on biodiversity. EGS Climate Change and natural disasters Source: Sudmeier-Rieux et al. 2006 BACK TO LINEAR OUTLINE BACK TO SYSTEMIC OUTLINE Slide 12/12
Decentralized Plans Spatial plans Sector Plans Integrated EGS Systemic Model in Policy and Financial Planning Innovative Finance Mechanisms Assess & Value Ecosystem Goods & Services Secure environmental vision and governance Environmental Fiscal Reform Medium Term Expenditure Framework Monitor results, develop and share knowledge Demystifying “environmental jargon” EGS benefits feed into Sustainable Development & Poverty Reduction Strategies EGS in Development/ Poverty/ Disasters
Governance and Vision Development planning with sound environmental vision and governance can favor sustainable results: Governance Environmental Vision Building governance and vision Strengthen environmental governance Working with nature BACK TO LINEAR OUTLINE BACK TO SYSTEMIC OUTLINE
Environmental Governance: Definition Three main factors can shape the management of natural resources and governance-related arrangements these are: • The characteristics of natural resources (water, minerals, timber…); • The actors involved (private and the public, business and consumers, as well as local communities and Indigenous Peoples); • The institutional framing and rules (Role of ministries and government institutions). Building governance and vision Source: OECD 2009 BACK TO LINEAR OUTLINE BACK TO SYSTEMIC OUTLINE Slide 1/2
Environmental Governance: Land Rights andAccess to Resources Securing equitable access and benefit sharing to genetic resources appears as the 3rd objective of the CBD. This objective has expanded to include mechanisms to share various types of EGS. Strengthen Land Rights and Fair Access to Resources Building governance and vision • Review how natural resources are used, controlled and shared by stakeholders including poor and vulnerable groups; • Delegate the management of public lands to poor communities as a way of empowering them; • Ensure the transparent and democratic governance of natural resources with active involvement and representation of communities. BACK TO LINEAR OUTLINE BACK TO SYSTEMIC OUTLINE Slide 2/2
Set Long Term Environmental Vision Building an inclusive long term development vision of EGS Green Constitutions & Legal Initiatives National Priorities NSDS Building governance and vision Global environ. commitments Policies integrative of Multilateral Environmental Agreements Constitutions which refer directly to environmental rights Clear reference to ecosystem/biodiversity objectives in long term development strategies BACK TO LINEAR OUTLINE BACK TO SYSTEMIC OUTLINE Slide 1/2
Policy and strategy tools >> Ecuador Constitution - Chapter 7 outlines the rights of the environment Article 71 states that the environment, or Pachamama, has the right to be respected and that its cycle structure, functions, and evolutionary processes should be maintained and regenerated. Every person, community, and nation should enforce the rights of nature, the article maintains, while the state is to provide incentives to protect nature and promote its rights. Article 74 provides a description of the rights of people, communities, and nations to benefit from the environment and natural riches that allow them to live well. Building governance and vision BACK TO LINEAR OUTLINE BACK TO SYSTEMIC OUTLINE Slide 2/2
Decentralized Plans Spatial plans Sector Plans Integrated EGS Systemic Model in Policy and Financial Planning Innovative Finance Mechanisms Assess & Value Ecosystem Goods & Services Secure environmental vision and governance Environmental Fiscal Reform Medium Term Expenditure Framework Monitor results, develop and share knowledge Demystifying “environmental jargon” EGS benefits feed into Sustainable Development & Poverty Reduction Strategies EGS in Development/ Poverty/ Disasters
Limits of Economic Models “Society musturgently replace its defective economic compass so that it does not jeopardize human well-being and planetary health through the under-valuation and consequent loss of ecosystems and biodiversity.” Assessment and valuation of EGS Source: Pavan Sukhdev, Study Leader: The Economics of Ecosystems and Biodiversity - COP 9 BACK TO LINEAR OUTLINE BACK TO SYSTEMIC OUTLINE Slide 1/5
Assessment and Valuation of EGS EGS assessment and valuation are crucial to recognize the importance of integrating biodiversity and ecosystems within planning processes by allowing the following: Assessment and valuation of EGS • Providing justification relative to EGS; • Building EGS argumentation ; • Raising EGS awareness; • Enhancing planning processes and success based on EGS. BACK TO LINEAR OUTLINE BACK TO SYSTEMIC OUTLINE Slide 2/5
Assessment and Valuation of EGS • Annual value of some Ecosystem Goods and Services is estimated at: • World fish catch – US$58 billion (EGS provisioning service). • Anti-cancer agents from marine organisms – up to US$1 billion/year (EGS provisioning service). • Global herbal medicine market – roughly US$43 billion in 2001 (EGS provisioning service). • Honeybees as pollinators for agriculture crops – US$2–8 billion/year (EGS regulating service). • Coral reefs for fisheries and tourism – US$30 billion/year (EGS cultural service). THE TOOLBOX Assessment and valuation of EGS Source: UNEP 2007 BACK TO LINEAR OUTLINE BACK TO SYSTEMIC OUTLINE Slide 3/5
Economic Valuation of EGS Source: EU 2008 Areas in white triangles are where EGS is not specified Monetary: e.g. avoided water purification costs, value of food provision, value of carbon storage Monetary valuation THE TOOLBOX Assessment and valuation of EGS Quantitative assessment Quantitative: e.g. cubic meters of water purified, tons of carbon stored, share of population affected by loss of food provisioning Qualitative review Qualitative: range and materiality of various ecosystem and biodiversity benefits provided by the ecosystem instance being evaluated, & knowledge gaps Full range of ecosystem services underpinned by biodiversity BACK TO LINEAR OUTLINE BACK TO SYSTEMIC OUTLINE Slide 4/5
US$ per ha per year Values of 7 Ecosystem Goods and Services in Wetlands Click for more facts Previous Next THE TOOLBOX Assessment and valuation of EGS Source: EU 2009 BACK TO LINEAR OUTLINE BACK TO SYSTEMIC OUTLINE Slide 5/5
Decentralized Plans Spatial plans Sector Plans Integrated EGS Systemic Model in Policy and Financial Planning Innovative Finance Mechanisms Assess & Value Ecosystem Goods & Services Secure environmental vision and governance Environmental Fiscal Reform Medium Term Expenditure Framework Monitor results, develop and share knowledge Demystifying “environmental jargon” EGS benefits feed into Sustainable Development & Poverty Reduction Strategies EGS in Development/ Poverty/ Disasters
Integrative and EGS Inclusive Planning Decentralized Plans Sectors Plans Spatial Plans Integrative and EGS inclusive planning Plan in terms of spatial layers Include green considerations Plan at lowest level possible BACK TO LINEAR OUTLINE BACK TO SYSTEMIC OUTLINE
Guiding Questions for Policy Makers • What are the main ecosystem services that a country’s economy relies on? • How will the proposed policy/strategy depend on ecosystem services? • How will the proposed policy/strategy change the indirect and direct drivers affecting these ecosystem services? What will be the impact of the change in drivers on the ecosystem services? • What is known about the status and trends of these services? • Under what conditions will it be appropriate to quantify the economic and societal values of ecosystem services? What methods are available to estimate these values? How will economic development and human well-being be affected by a decline in the quality and delivery of ecosystem services and, conversely, what opportunities do ecosystem services provide to improve economic development and human well-being? And for which groups or stakeholders? Integrative and EGS inclusive planning Source: OECD 2008 BACK TO LINEAR OUTLINE BACK TO SYSTEMIC OUTLINE Slide 1/2
Guiding Questions for Policy Makers (cont’d) • How can future ecosystem service changes be explored? • How can ecosystem service risks and opportunities be incorporated into the development strategy? • What policies can help sustain ecosystem services? • What capacity development is needed? • Have important ecosystem services been mapped? • Are the quantity and quality of ecosystem services included in the monitoring scheme? If a baseline includes ecosystem services, indicators of these services can be used as “key performance indicators” in the Poverty Reduction Strategy Paper (PRSP) or development strategy of a country. Integrative and EGS inclusive planning Source: OECD 2008 BACK TO LINEAR OUTLINE BACK TO SYSTEMIC OUTLINE Slide 2/2
Examples of Common Environmental Policy Challenges • Lack of political support/will to environmental initiatives • Limited power/influence of environment ministry • Limited resources/capacities for environmental activities • Limited understanding and access to knowledge about ecosystem goods and services • Economic growth and development needs focusing on short to medium term income generation • Limited capacity of conventional economic approaches to capture role/benefits ecosystem goods and services • Lack of environmental data to reinforce EGS knowledge • Lack of transparent and coherent mechanisms to evaluate what has been (or needs to be) spent on the environment Integrative and EGS inclusive planning BACK TO LINEAR OUTLINE BACK TO SYSTEMIC OUTLINE Slide 1/1
Why? How? Sector Plans • Sector priorities and need for generating rapid economic returns can “obscure” the importance of environmental sustainability and the role of EGS ; • Ecosystem services are often required to meet diverging sector goals. Integrative and EGS inclusive planning • Conducting an ecosystem assessment to determine the EGS condition, role and value to development ; • Using mechanisms promoting sector dialogue with, and input by, environment ministry and stakeholders (e.g. sector working groups, sector wide approaches…); • Including relevant EGS issues found in multilateral environmental agreements within sector plans( National Biodiversity Strategies and Action plans…); • Using best environmental practices and techniques; • Balancing EGS needs and use between sectors. BACK TO LINEAR OUTLINE BACK TO SYSTEMIC OUTLINE Slide 1/3