Download
1 / 29
290 likes | 430 Views
SKF Half-year results 2012. Tom Johnstone, President and CEO 18 July 2012. Highlights Q2 2012. New businesses - A five-year contract for integrated maintenance solutions with the Brazilian pulp and paper company Fibria.

E N D
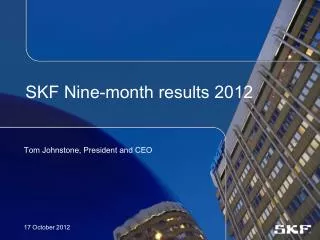
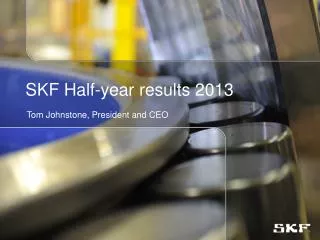
SKF Half-year results 2012 Tom Johnstone, President and CEO 18 July 2012
Highlights Q2 2012 • New businesses • - A five-year contract for integrated maintenance solutions with • the Brazilian pulp and paper company Fibria. • - A seven-year contract with Volvo Car Corporation for the delivery of rear wheel bearing units and front suspension bearing units. • - A three-year supply agreement for the new generation NautilusTM bearing with a major wind turbine manufacturer. • New facilities: • - Railway test centre in Tver, Russia • - SKF Solution Factory in Perth, Australia • New products: • New app: New generation SKF System 24 Shaft sealing solution SKF Seal Select App
Highlights Q2 2012 • SKF launched the BeyondZeroTM portfolio with products • and solutions, which will both improve energy efficiency and reduce the environmental impact. • SKF revised targets for its climate strategy and also partnered with the WWF in their Climate Savers Programme. • SKF announced the divestment of its distributor businesses in Australia and New Zealand • SKF renewed its partnership with Scuderia Ferrari. Growth target: SEK 2.5 bn to SEK 10 bn by 2016
SKF Group - Q2 2012 • Financial performance Q2 2012 Q2 2011 • Net sales, SEKm 17,174 16,712 • Operating profit, SEKm 2,053 2,623 • Operating margin, % 12.0 15.7 • Profit before tax, SEKm 1,801 2,446 • Cash flow, SEKm 686 1,300 • SKF took steps to reduce its cost base in Europe. The quarter included one-time costs of around SEK 140 million. • Organic sales growth in local currency: • SKF Group: -0.8% • Europe: -3.4% Industrial market, Strategic Industries: +0.6% • North America: +8.5% Industrial market, Regional Sales and Service: +0.6% • Asia: -7.9% Automotive: -4.6% • Latin America: +16.6% • Key points • Volumes down by 2.8% y-o-y • Manufacturing level significantly lower y-o-y • Inventories relatively unchanged
Organic sales growth in local currency % change y-o-y 2010 2011 2012
Sales volume % change y-o-y 2010 2011 2012
Growth development by geographyOrganic growth in local currency Q2 2012 vs Q2 2011 Europe-3.4% North America +8.5% Asia/Pacific -7.9% Latin America +16.6% Middle East & Africa +1.7%
Growth development by geographyOrganic growth in local currency YTD 2012 vs YTD 2011 Europe-2.3% North America +11.6% Asia/Pacific -8.0% Latin America +13.8% Middle East & Africa +2.2%
Growth in local currency Long-term target: 8% per annum % y-o-y 16.3%* 14.2% 0.1% * whereof acquisition 4.8%
Components in net sales 2010 2011 2012 Percent y-o-y
Operating profit SEKm 2012 2011 2010 One-time items
Operating margin Long-term target level: 15% % 2010 2011 2012 One-time items
Operating margin Long-term target level: 15% % 14.7* 14.2* 12.7* 14.5 13.8 12.3 One-time items * Excluding one-time items
Operating margin per business area % Regional Sales and Service Strategic Industries Automotive 2011 2012 2010 Excluding one-off items(eg. restructuring, impairments, capital gains)
Inventories as % of annual sales Long-term target level: 18% % 2010 2011 2012
Cash flow, after investments before financing SEKm * 2011 2012 2010 * SEK 798 million,excluding SEK 6,799 million for the acquisition of Lincoln.
Return on capital employed Long-term target: 27% % 24.0 23.6 20.0 ROCE: Operating profit plus interest income, as a percentage of twelve months rolling average of total assets less the average of non-interest bearing liabilities.
Net debt SEKm AB SKF, dividend paid (SEKm): 2010 Q2 1,594 2011 Q2 2,277 2012 Q2 2,504 Cash out from acquisition (SEKm): 2010 6,799 2011 2012 2010 Net debt: Loans and net provisions for post-employment benefits less short-term financial assets excluding derivatives.
Debt structure,maturity years EURm 500 396 130 110 100 100 0 • Credit facilities: EUR 500 million 2014 SEK 3,000 million 2017 • No financial covenants nor material adverse change clause
July 2012: SKF demand outlook Q3 2012 • Demand compared to the third quarter last year • The demand for SKF’s products and services is expected to be relatively unchanged for the Group. It is expected to be lower in Europe, relatively unchanged in Asia, higher in North America and slightly higher in Latin America. The demand is expected to be slightly higher for Industrial Strategic Industries and relatively unchanged for Automotive and Industrial Regional Sales and Service. • Demand compared to the second quarter 2012 • The demand for SKF’s products and services is expected to be relatively unchanged for the Group. It is expected to be slightly lower in Europe, relatively unchanged in Asia and North America and higher in Latin America. The demand is expected to be relatively unchanged for Industrial Strategic Industries and Industrial Regional Sales and Service and slightly lower for Automotive. • Manufacturing level • The manufacturing level is expected to be lower year on year and slightly lower compared to the second quarter.
SKF demand outlook Q3 2012, regions * Previously published shares have been restated to reflect the total Group business and customer delivery locations.
SKF sequential demand trend Q3 2012 Share of net sales 2011* * Previously published shares have been restated to reflect the total Group business and customer delivery locations.
Guidance for the third quarter 2012 • Tax level: around 30% • Financial net for the third quarter:Around SEK -180 million • Exchange rates on operating profit versus 2011 Q3: SEK 125 million • Full year: SEK 350 million • Additions to PPE: Around SEK 2.0 billion for 2012 Guidance is approximate and based on current assumptions and exchange rates
Key focus areas ahead 2012 • Managing the uncertain and different demand environment • - regions and segments • Profit and cash flow • - inventory management • Initiatives and actions to support long-term financial targets • Continue the integration of Lincoln • Business Excellence and competence development • Implement the new organization for the Industrial market One SKF and SKF Care as guiding lights
Cautionary statement • This presentation contains forward-looking statements that are based on the current expectations of the management of SKF. • Although management believes that the expectations reflected in such forward-looking statements are reasonable, no assurance can be given that such expectations will prove to have been correct. Accordingly, results could differ materially from those implied in the forward-looking statements as a result of, among other factors, changes in economic, market and competitive conditions, changes in the regulatory environment and other government actions, fluctuations in exchange rates and other factors mentioned in SKF's latest annual report (available on www.skf.com) under the Administration Report; “Important factors influencing the financial results", "Financial risks" and "Sensitivity analysis”.