Download
1 / 29
290 likes | 360 Views
Screen. Cabinet. Cabinet. Lecturer’s desk. Table. Computer Storage Cabinet. Row A. 3. 4. 5. 19. 6. 18. 7. 17. 16. 8. 15. 9. 10. 11. 14. 13. 12. Row B. 1. 2. 3. 4. 23. 5. 6. 22. 21. 7. 20. 8. 9. 10. 19. 11. 18. 16. 15. 13. 12. 17. 14. Row C. 1. 2.

E N D
Screen Cabinet Cabinet Lecturer’s desk Table Computer Storage Cabinet Row A 3 4 5 19 6 18 7 17 16 8 15 9 10 11 14 13 12 Row B 1 2 3 4 23 5 6 22 21 7 20 8 9 10 19 11 18 16 15 13 12 17 14 Row C 1 2 3 24 4 23 5 6 22 21 7 20 8 9 10 19 11 18 16 15 13 12 17 14 Row D 1 2 25 3 24 4 23 5 6 22 21 7 20 8 9 10 19 11 18 16 15 13 12 17 14 Row E 1 26 2 25 3 24 4 23 5 6 22 21 7 20 8 9 10 19 11 18 16 15 13 12 17 14 Row F 27 1 26 2 25 3 24 4 23 5 6 22 21 7 20 8 9 10 19 11 18 16 15 13 12 17 14 28 Row G 27 1 26 2 25 3 24 4 23 5 6 22 21 7 20 8 9 29 10 19 11 18 16 15 13 12 17 14 28 Row H 27 1 26 2 25 3 24 4 23 5 6 22 21 7 20 8 9 10 19 11 18 16 15 13 12 17 14 Row I 1 26 2 25 3 24 4 23 5 6 22 21 7 20 8 9 10 19 11 18 16 15 13 12 17 14 1 Row J 26 2 25 3 24 4 23 5 6 22 21 7 20 8 9 10 19 11 18 16 15 13 12 17 14 28 27 1 Row K 26 2 25 3 24 4 23 5 6 22 21 7 20 8 9 10 19 11 18 16 15 13 12 17 14 Row L 20 1 19 2 18 3 17 4 16 5 15 6 7 14 13 INTEGRATED LEARNING CENTER ILC 120 9 8 10 12 11 broken desk Ella Fitzgerald sings “Tea for Two”
Introduction to Statistics for the Social SciencesSBS200, COMM200, GEOG200, PA200, POL200, or SOC200Lecture Section 001, Spring, 2014Room 120 Integrated Learning Center (ILC)10:00 - 10:50 Mondays, Wednesdays & Fridays. Welcome http://www.youtube.com/watch?v=oSQJP40PcGI
Please click in My last name starts with a letter somewhere between A. A – D B. E – L C. M – R D. S – Z
Use this as your study guide By the end of lecture today2/26/14 Counting ‘standard deviationses’ – z scores Connecting raw scores, z scores and probabilityConnecting probability, proportion and area of curve Percentiles
Schedule of readings Before next exam (March 7th) Please read chapters 5, 6, & 8 in Ha & Ha Please read Chapters 10, 11, 12 and 14 in Plous Chapter 10: The Representativeness Heuristic Chapter 11: The Availability Heuristic Chapter 12: Probability and Risk Chapter 14: The Perception of Randomness
Lab sessions Labs continue this week with Project 1
One positive correlation One negative correlation One t-test
Homework due – Friday (February 28th) On class website: Please print and complete homework worksheet #11 Calculating z-score, raw scores and areas under normal curve
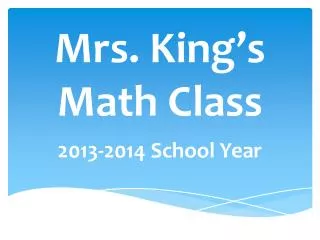
Mean = 100 Standard deviation = 5 If we go up one standard deviation z score = +1.0 and raw score = 105 If we go down one standard deviation z score = -1.0 and raw score = 95 85 90 95 100 105 110 115 If we go up two standard deviations z score = +2.0 and raw score = 110 If we go down two standard deviations z score = -2.0 and raw score = 90 85 90 95 100 105 110 115 If we go up three standard deviations z score = +3.0 and raw score = 115 If we go down three standard deviations z score = -3.0 and raw score = 85 85 90 95 100 105 110 115 z score: A score that indicates how many standard deviations an observation is above or below the mean of the distribution z score = raw score - mean standard deviation Review
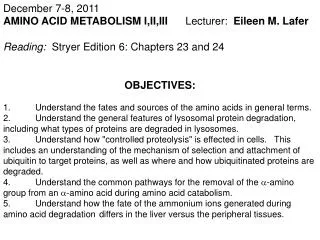
Raw scores, z scores & probabilities • Notice: • 3 types of numbers • raw scores • z scores • probabilities Mean = 50 Standard deviation = 10 z = -2 z = +2 If we go up two standard deviations z score = +2.0 and raw score = 70 If we go down two standard deviations z score = -2.0 and raw score = 30
Normal distribution Raw scores z-scores probabilities Z Scores Have z Find raw score Have z Find area z table Formula Have area Find z Area & Probability Raw Scores Have raw score Find z
. Homework Worksheet
Hint: Always draw a picture! Homework worksheet
. Homework Worksheet: Problem 1 1 sd 1 sd .68 30 32 28
. Homework Worksheet: Problem 2 2 sd 2 sd .95 32 28 34 26 30
. Homework Worksheet: Problem 3 3 sd 3 sd .997 24 36 32 28 34 26 30
. Homework Worksheet: Problem 4 .50 24 36 32 28 34 26 30
. Homework Worksheet: Problem 5 Go to table 33-30 z = 1.5 z = .4332 2 .4332 24 36 32 28 34 26 30
. Homework Worksheet: Problem 6 Go to table 33-30 z = 1.5 z = .4332 2 .9332 .4332 .5000 24 36 32 28 34 26 30
.0668 Go to table 33-30 .4332 z = 1.5 z = .4332 2 33 .5000 - .4332 = .0668 Go to table 29-30 z =-.5 z = .1915 .5000 .1915 2 .5000 + .1915 = .6915 29 .4938 .1915 25-30 25 31 z = -2.5 z = .4938 2 .4938 + .1915 = .6853 Go to table 31-30 z =.5 z = .1915 2 .0668 .4332 27-30 z = -1.5 z = .4332 27 .5000 - .4332 = .0668 2
Homework Worksheet Problem 11: .5000 + .4938 = .9938 Problem 12: .5000 - .3413 = .1587 Problem 13: 30 Problem 14: 28 and 32
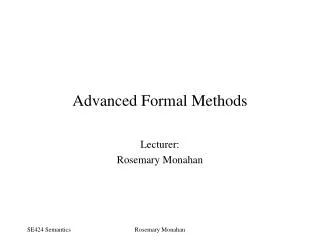
. 77th percentile Go to table nearest z = .74 .2700 x = mean + z σ = 30 + (.74)(2) = 31.48 .7700 .27 .5000 24 36 ? 28 34 26 30 31.48
. 13th percentile Go to table nearest z = 1.13 .3700 x = mean + z σ = 30 + (-1.13)(2) = 27.74 Note: .13 + .37 = .50 .37 .50 .13 ? 24 36 32 27.74 34 26 30
Homework Worksheet Problem 17: 68% or .68 or 68.26% or .6826 Problem 18: 95% or .95 or 95.44% or .9544 Problem 19: 99.70% or .9970 Problem 20: 27.34% or .2734
Please use the following distribution with a mean of 200 and a standard deviation of 40. Find the area under the curve between scores of 200 and 230. Start by filling in the desired information on curve 20 (to the right)(Note this one will require you to calculate a z-score for a raw score of 230 and use the z-table) Go to table 230-200 z = .75 z = .2734 40 .2734 80 320 240 160 280 120 200
Homework Worksheet Problem 21: 40.13% or .4013 Problem 22: 69.15% or .6915 Problem 23: 18.41% or .1841 Problem 24: 28.81% or .2881 Problem 25: 96.93% or .9693 or 96.93% or .9693 Problem 26: .89% or .0089 Problem 27: 95.99% or .9599 Problem 28: 4.01% or .0401 Problem 29: 293.2 x = mean + z σ = 200 + (2.33)(40) = 293.2 Problem 30: 182.4 x = mean + z σ = 200 + (-.44)(40) = 182.4 Problem 31: 190 Problem 32: 217.6
Thank you! See you next time!!